Packet Capture tools#
This page is not an activity to follow, but rather a reference guide with some packet capture options that may be useful for your activities. The ability to capture packets on the wire and inspect the headers is essential for troubleshooting. It also lets you understand whether traffic is flowing in clear text or as encrypted packets throughout your network.
In the following sections you will find several options for doing packet inspection in the hackathon topology provided to you, either relying on the provisioned VS Code Server, the well-known tcpdump and tshark command-line utilities or Wireshark running on your own system.
Choose the best option according to what is most suited to your environment, preference and convenience.
1. Edgeshark from VS Code#
Pre-installed in your hackathon environment is the Containerlab VS Code extension. This plugin has an integrated packet capture option that uses Edgeshark.
What is Edgeshark?
Edgeshark is an open-source, web-based tool created by Siemens that visualizes and captures network traffic in containerized environments, including containerlab and Kubernetes-in-Docker (KinD) environments. It eliminates the need to install capturing utilities (like tcpdump) inside your target containers.
Edgeshark consists of two containerized services named Ghostwire and Packetflix, and an optional Wireshark csharg external capture plugin for live remote capture of network traffic.
- Ghostwire: A discovery service that keeps track of the virtual communication layout and network namespaces.
- Packetflix: A packet streaming service that can capture network traffic on specific interfaces and stream it to clients over WebSockets.
- Wireshark csharg external capture plugin: A client tool that connects Packetflix to your local Wireshark application.
SR-SIM packet captures only display ingress packets.
Currently SR-SIM packet captures only display ingress packets. To see both directions you may capture on both sides of a link.
You may use Edgeshark directly from your VS Code IDE with the containerlab plugin when you connect the IDE to your hackathon instance. Alternatively, the instance comes deployed with a VS Code Server that has the necessary plugins pre-installed and preconfigured.
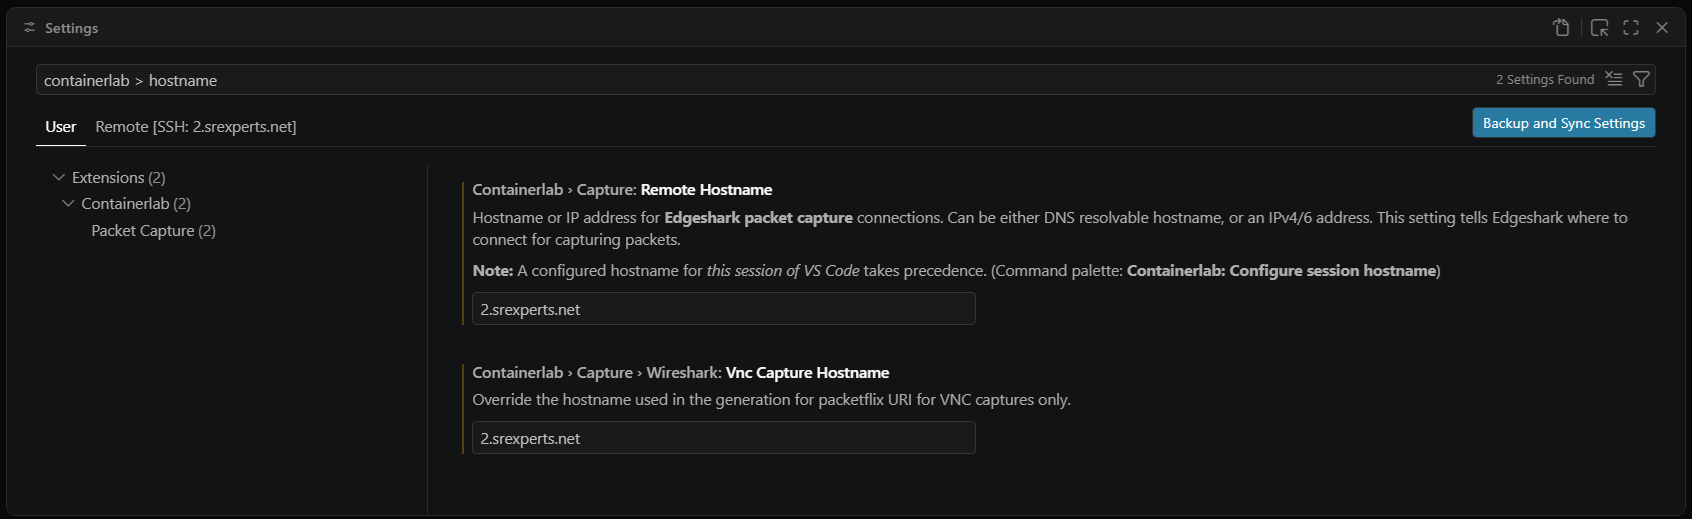
Hostname configuration in the containerlab extension
The containerlab topology you are interested in runs in your group's hackathon instance. You can connect to it using your local VS Code application's Remote SSH extension. If installed, this would enable most of the functionality of the containerlab extension outright, however the packet capture functionality will not work unless the hostname configuration has been updated. This is due to the way the URL that triggers the capture is built. In the code-server deployed on your instance this setting has been taken care of, if you want to have the same behavior locally the setting has to be similarly modified.
The correct value would be INSTANCE_ID.srexperts.net for the two fields, as shown here in the case where the assigned instance ID would be 2:
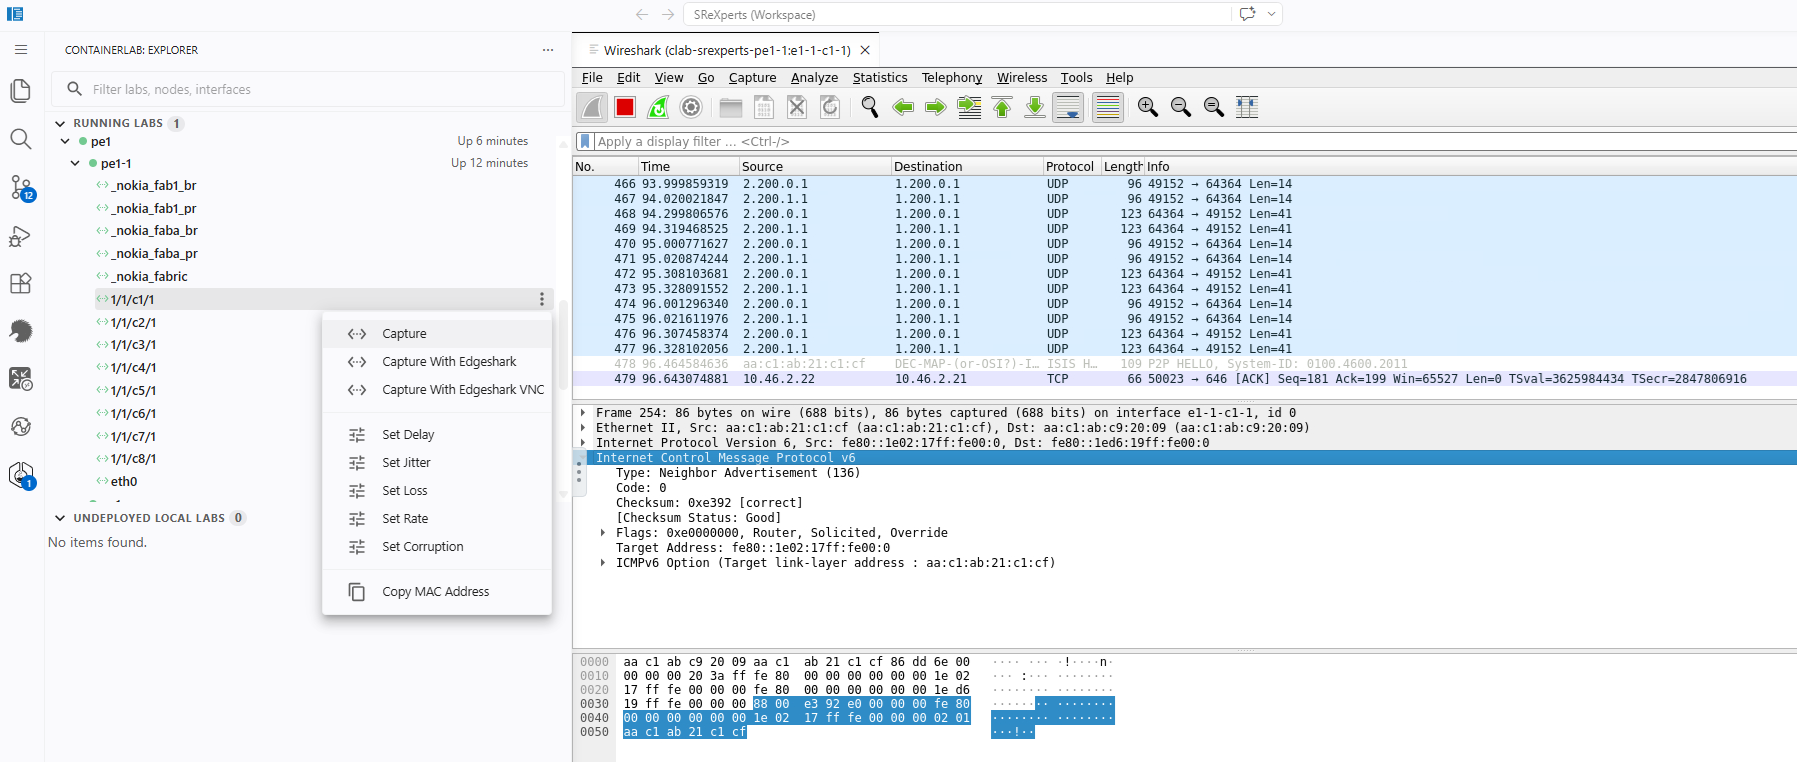
The containerlab plugin lets you select node interfaces in the explorer menu to capture from. When doing so it provides three options:
- Capture: Quick action; defaults to
3. - Capture with Edgeshark: Run Wireshark locally and stream data to it from Edgeshark. You require the cshargextcap plugin for this option.
- Capture with Edgeshark VNC: Run Wireshark remotely and stream with VNC
VS Code containerlab Extension
Refer to the VS Code containerlab extension documentation for instructions on how to install and use the extension.
Fig. 2 below shows the VS Code capture options in the explorer on the left. On the right you can see the running packet capture.
2. Edgeshark Web UI#
The second option for traffic capture is the Edgeshark Web UI. This option requires a little more setup as it requires the cshargextcap plugin, however it does mean packets are streamed directly to your own local Wireshark application making it simpler to save and store captures for documentation or reference purposes.
Edgeshark has been installed in your group's hackathon instance, it exposes an HTTP Web UI on port 5001. You can access Edgeshark using your preferred web browser at the link below (replace ${INSTANCE_ID} with your assigned ID):
SSH port forwarding if you cannot use port 5001
In case you don't have direct reachability to your group's hackathon instance on TCP port 5001 but you can SSH to it, you can setup and use SSH port forwarding as an alternative. For example:
This will forward your local system's TCP port 5001 to the same port on your group's hackathon instance. When you then navigate to 127.0.0.1:5001 in your browser you will see the Edgeshark Web UI.
Edgeshark allows you to visualize all containers in your server, select the interfaces you want to capture, and stream the capture to your local Wireshark application. It allows you to use regex to filter your containers from the hamburger menu. This means that if you filter by pe1 it will only display the containers whose name matches your filter.
The Web UI allows you to select multiple capture interfaces simultaneously when you enable the "multi-fin" button as shown in Fig. 3 below:
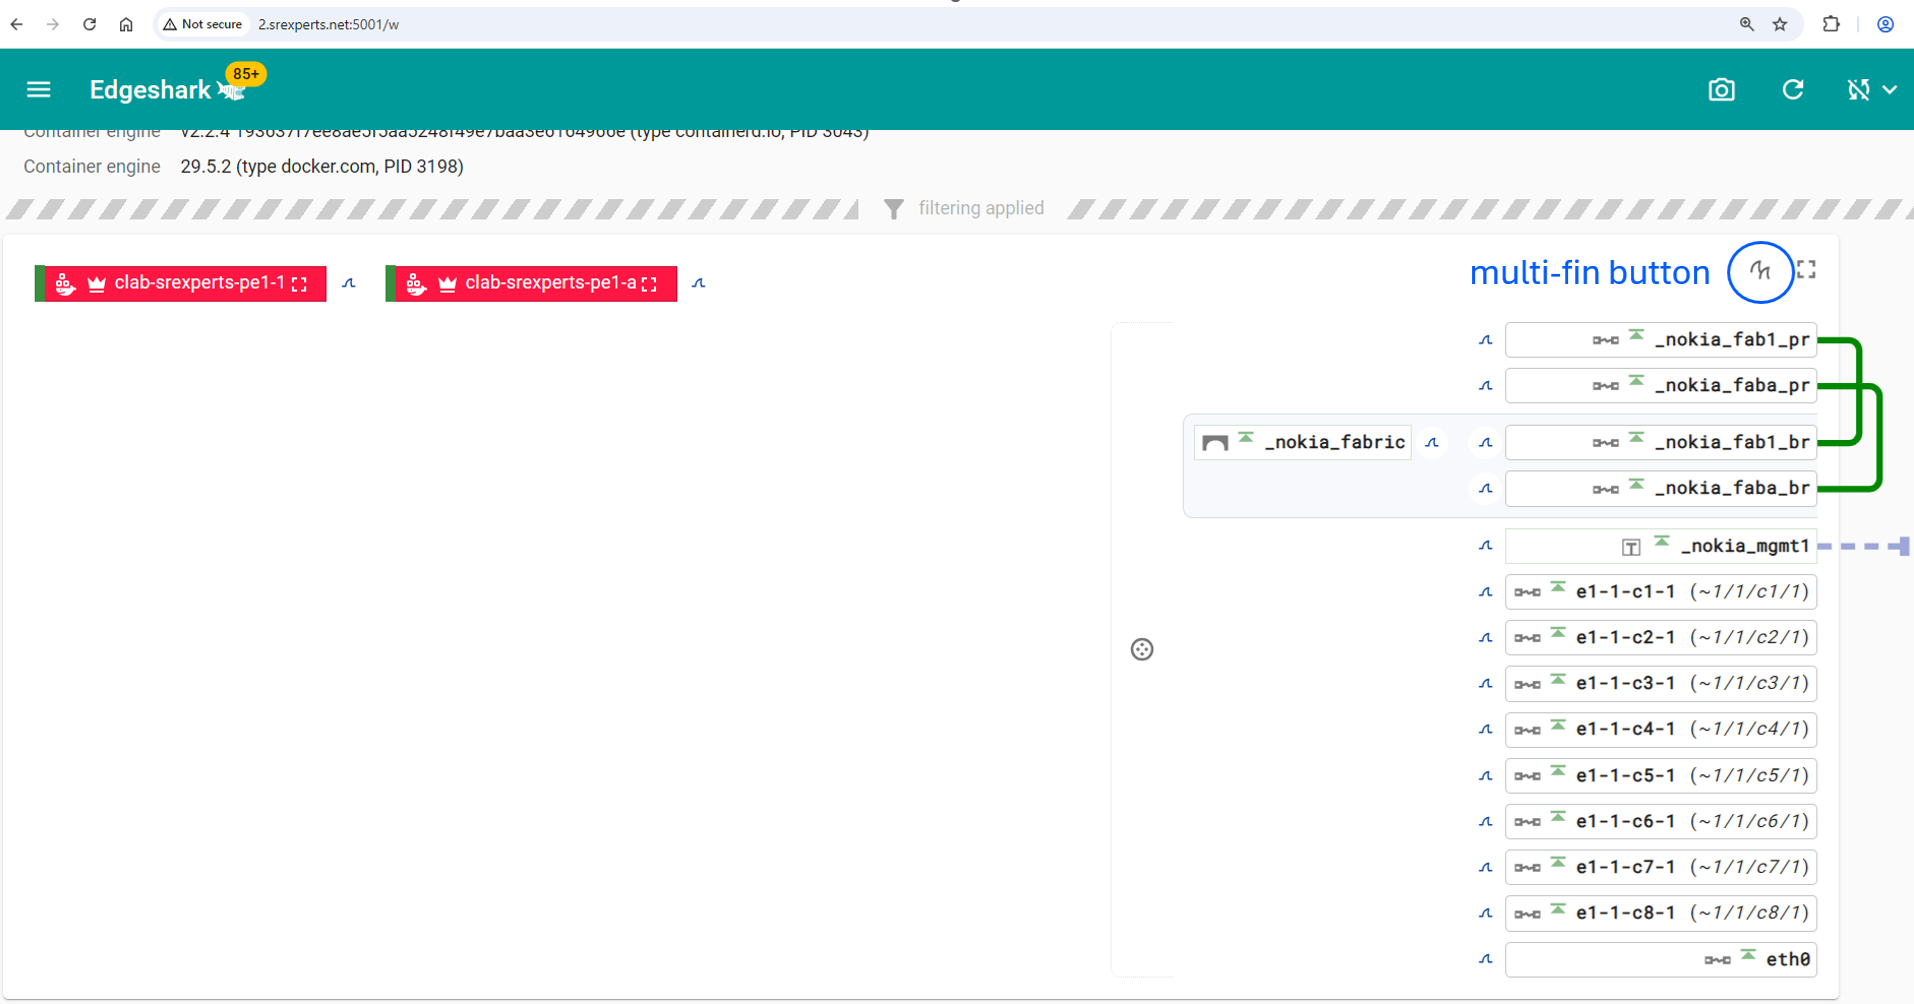
If you select one or more interfaces to capture from and have installed the required plugin, you can start capturing packets that will show up in your local Wireshark application by clicking on the appropriate "single-fin" button.
3. Tshark and tcpdump#
Last, but most definitely not least, we have the traditional command-line utilities, including tcpdump and tshark. These applications are available from your group's hackathon instance. One advantage of tcpdump is that it is available in most Linux systems, however it is limited in decoding protocols. Tshark has more decoding capabilities and allows you to select multiple specific interfaces to capture.
To make use of either application to inspect traffic going through your hackathon topology, be aware that this traffic is in a different namespace, separate from your main Linux environment. A network namespace provides an isolated networking stack, including network interfaces, routing tables, ARP/neighbor tables, firewall rules (iptables/nftables) and socket space. Processes running in different network namespaces behave as if they were on different machines from a networking perspective.
To access the network namespace where you'll be able to capture topology traffic you will need to use the ip netns command.
Using ip netns exec
You can switch to the appropriate network namespace (netns) to execute your commands from with the ip netns command from your group's hackathon instance.
When containerlab starts a node, it typically creates containers and each container gets its own network namespace. This is useful when the container image doesn't include debugging tools like ping, tcpdump, tshark or ip. You can use the tools installed on the host while operating from the container's network namespace without entering the container.
Use ip netns list to see the existing namespaces and then use ip netns exec to run commands from inside the container's namespaces.
$ sudo ip netns list
clab-srexperts-syslog (id: 41)
clab-srexperts-loki (id: 40)
clab-srexperts-bngblaster (id: 39)
clab-srexperts-transit1 (id: 38)
clab-srexperts-dns (id: 37)
clab-srexperts-gnmic (id: 36)
clab-srexperts-prometheus (id: 35)
clab-srexperts-radius (id: 34)
clab-srexperts-p1-a (id: 32)
clab-srexperts-leaf11 (id: 33)
clab-srexperts-p1-1 (id: 32)
clab-srexperts-agg1 (id: 31)
clab-srexperts-pe2-a (id: 29)
clab-srexperts-spine21 (id: 30)
clab-srexperts-pe2-1 (id: 29)
clab-srexperts-p2-a (id: 28)
clab-srexperts-p2-1 (id: 28)
clab-srexperts-spine12 (id: 27)
clab-srexperts-client04 (id: 26)
clab-srexperts-client22 (id: 25)
clab-srexperts-client03 (id: 24)
clab-srexperts-client12 (id: 23)
clab-srexperts-client02 (id: 21)
clab-srexperts-client21 (id: 22)
clab-srexperts-client23 (id: 20)
clab-srexperts-client13 (id: 19)
clab-srexperts-client01 (id: 18)
clab-srexperts-client11 (id: 17)
clab-srexperts-rpki (id: 16)
clab-srexperts-grafana (id: 15)
clab-srexperts-promtail (id: 14)
clab-srexperts-vRR (id: 13)
clab-srexperts-vsr-nrc (id: 12)
clab-srexperts-leaf12 (id: 11)
clab-srexperts-leaf23 (id: 10)
clab-srexperts-peering2 (id: 9)
clab-srexperts-pe4-a (id: 8)
clab-srexperts-pe4-b (id: 8)
clab-srexperts-pe4-2 (id: 8)
clab-srexperts-pe1-a (id: 7)
clab-srexperts-pe4-1 (id: 8)
clab-srexperts-pe1-1 (id: 7)
clab-srexperts-pe3-a (id: 5)
clab-srexperts-leaf22 (id: 6)
clab-srexperts-pe3-1 (id: 5)
clab-srexperts-leaf13 (id: 4)
clab-srexperts-ixp1 (id: 2)
clab-srexperts-spine11 (id: 3)
clab-srexperts-spine22 (id: 0)
clab-srexperts-leaf21 (id: 1)
$ sudo ip netns exec clab-srexperts-client01 ip route
default via 10.128.2.1 dev eth0
10.0.0.0/8 via 10.64.21.1 dev eth1.1
10.64.21.0/27 dev eth1.1 proto kernel scope link src 10.64.21.11
10.128.2.0/24 dev eth0 proto kernel scope link src 10.128.2.25
192.168.0.0/16 via 192.168.21.1 dev eth1.300
192.168.21.0/24 dev eth1.300 proto kernel scope link src 192.168.21.11
192.168.51.0/24 dev eth1.1001 proto kernel scope link src 192.168.51.1
192.168.52.0/24 dev eth1.1002 proto kernel scope link src 192.168.52.1
192.168.53.0/24 dev eth1.1003 proto kernel scope link src 192.168.53.1
192.168.54.0/24 dev eth1.1004 proto kernel scope link src 192.168.54.1
You can compare the output above to what you see on clab-srexperts-client01 when you log in using SSH and execute the same command without changing namespaces. You will find this output matches.
Below you will find references of how you can use these network namespace commands with the two available packet capture tools.
tshark
The following example capture packets in two interfaces simultaneously and filters for MPLS traffic
nokia@2:~$ sudo ip netns exec clab-srexperts-pe1-1 tshark -l -i e1-1-c1-1 -i e1-1-c2-1 -Y mpls -V
Running as user "root" and group "root". This could be dangerous.
Capturing on 'e1-1-c1-1' and 'e1-1-c2-1'
Frame 4: 64 bytes on wire (512 bits), 64 bytes captured (512 bits) on interface e1-1-c2-1, id 1
    Section number: 1
    Interface id: 1 (e1-1-c2-1)
        Interface name: e1-1-c2-1
    Encapsulation type: Ethernet (1)
    Arrival Time: Jun  2, 2026 21:07:55.987899345 UTC
    UTC Arrival Time: Jun  2, 2026 21:07:55.987899345 UTC
    Epoch Arrival Time: 1780434475.987899345
    [Time shift for this packet: 0.000000000 seconds]
    [Time delta from previous captured frame: -0.030296322 seconds]
    [Time delta from previous displayed frame: 0.000000000 seconds]
    [Time since reference or first frame: 0.118115206 seconds]
    Frame Number: 4
    Frame Length: 64 bytes (512 bits)
    Capture Length: 64 bytes (512 bits)
    [Frame is marked: False]
    [Frame is ignored: False]
    [Protocols in frame: eth:ethertype:mpls:udp:data]
Ethernet II, Src: aa:c1:ab:00:eb:b6 (aa:c1:ab:00:eb:b6), Dst: aa:c1:ab:6a:48:59 (aa:c1:ab:6a:48:59)
    Destination: aa:c1:ab:6a:48:59 (aa:c1:ab:6a:48:59)
        .... ..1. .... .... .... .... = LG bit: Locally administered address (this is NOT the factory default)
        .... ...0 .... .... .... .... = IG bit: Individual address (unicast)
    Source: aa:c1:ab:00:eb:b6 (aa:c1:ab:00:eb:b6)
        .... ..1. .... .... .... .... = LG bit: Locally administered address (this is NOT the factory default)
        .... ...0 .... .... .... .... = IG bit: Individual address (unicast)
    Type: MPLS label switched packet (0x8847)
    [Stream index: 2]
MultiProtocol Label Switching Header, Label: 21121, Exp: 0, S: 0, TTL: 254
    0000 0101 0010 1000 0001 .... .... .... = MPLS Label: 21121 (0x05281)
    .... .... .... .... .... 000. .... .... = MPLS Experimental Bits: 0
    .... .... .... .... .... ...0 .... .... = MPLS Bottom Of Label Stack: 0
    .... .... .... .... .... .... 1111 1110 = MPLS TTL: 254
MultiProtocol Label Switching Header, Label: 524285, Exp: 0, S: 1, TTL: 255
    0111 1111 1111 1111 1101 .... .... .... = MPLS Label: 524285 (0x7fffd)
    .... .... .... .... .... 000. .... .... = MPLS Experimental Bits: 0
    .... .... .... .... .... ...1 .... .... = MPLS Bottom Of Label Stack: 1
    .... .... .... .... .... .... 1111 1111 = MPLS TTL: 255
Internet Protocol Version 4, Src: 2.201.0.1, Dst: 1.201.0.1
    0100 .... = Version: 4
    .... 0101 = Header Length: 20 bytes (5)
    Differentiated Services Field: 0x00 (DSCP: CS0, ECN: Not-ECT)
        0000 00.. = Differentiated Services Codepoint: Default (0)
        .... ..00 = Explicit Congestion Notification: Not ECN-Capable Transport (0)
    Total Length: 42
    Identification: 0x6e4f (28239)
    000. .... = Flags: 0x0
        0... .... = Reserved bit: Not set
        .0.. .... = Don't fragment: Not set
        ..0. .... = More fragments: Not set
    ...0 0000 0000 0000 = Fragment Offset: 0
    Time to Live: 255
    Protocol: UDP (17)
    Header Checksum: 0x48e0 [validation disabled]
    [Header checksum status: Unverified]
    Source Address: 2.201.0.1
    Destination Address: 1.201.0.1
    [Stream index: 2]
User Datagram Protocol, Src Port: 49152, Dst Port: 64364
    Source Port: 49152
    Destination Port: 64364
    Length: 22
    Checksum: 0xcdd1 [unverified]
    [Checksum Status: Unverified]
    [Stream index: 2]
    [Stream Packet Number: 1]
    [Timestamps]
        [Time since first frame: 0.000000000 seconds]
        [Time since previous frame: 0.000000000 seconds]
    UDP payload (14 bytes)
Data (14 bytes)

0000  00 00 0c 9b ed c9 c4 ab fa 38 b8 a4 00 01         .........8....
    Data: 00000c9bedc9c4abfa38b8a40001
    [Length: 14]

... <snip>
tcpdump
tcpdump allows you to select one or all interfaces. If you want to capture traffic on two interfaces simultaneously you will need to execute two commands using separate sessions, or use the any keyword to capture traffic on all ports in promiscuous mode if that is supported by the device in question.
nokia@2:~$ sudo ip netns exec clab-srexperts-pe1-1 tcpdump -lnnvvvi e1-1-c1-1 mpls
tcpdump: listening on e1-1-c1-1, link-type EN10MB (Ethernet), snapshot length 262144 bytes
21:18:21.225424 MPLS (label 21121, tc 6, [S], ttl 63)
        IP6 (class 0xc0, flowlabel 0xa3bec, hlim 63, next-header TCP (6) payload length: 32) fd00:fde8::2:13.179 > fd00:fde8::2:43.43601: Flags [.], cksum 0x3d59 (correct), seq 3214598847, ack 1465491167, win 27297, options [nop,nop,TS val 3404859096 ecr 2679972725], length 0
21:18:21.276798 MPLS (label 21121, tc 6, [S], ttl 63)
        IP6 (class 0xc0, flowlabel 0xa3bec, hlim 63, next-header TCP (6) payload length: 51) fd00:fde8::2:13.179 > fd00:fde8::2:43.43601: Flags [P.], cksum 0x38f7 (correct), seq 0:19, ack 1, win 27297, options [nop,nop,TS val 3404859148 ecr 2679972725], length 19: BGP
        Keepalive Message (4), length: 19
Linux vs NOS interface syntax
To capture traffic in your group's hackathon instance you need to use the interface aliases known in Linux. These differ from the interface names defined in the containerlab topology and used by the containerized routers themselves. The Edgeshark Web UI may help, as it provides both names in a single view (see above) and you may be able to derive the required syntax yourself. For example:
- SR OS SR-SIM interface
1/1/c1/1becomese1-1-c1-1 - SR Linux interface
ethernet-1/32becomese1-32
4. Streaming a remote capture into Wireshark#
An additional option you may be interested in pursuing involves setting up an SSH session solely to run a packet capture command, and streaming the result directly to your Wireshark application for interpretation. This is similar to the SSH session built for Edgeshark previously as it is done via arguments passed to your SSH client. To accomplish this, you'll need to SSH from your laptop to your group's hackathon instance and start a capture redirecting the output to your Wireshark application.
Template and Example
ssh [email protected] "sudo ip netns exec clab-srexperts-pe1-1 tshark -l -i e1-1-c1-1 -i e1-1-c2-1 -w -" | "c:\Program Files\Wireshark\Wireshark.exe" -k -i -
Complete the template with values for INSTANCE_ID, CONTAINER, one or more IF# names and the path to your Wireshark executable to start capturing traffic with this method.
5. ANYsec packet dissectors#
ANYsec is a built-in network encryption technology available on a selection of Nokia routers. In some of the activities, you may be interested in seeing when or where ANYsec traffic is flowing through your network. By default Wireshark does not decode ANYsec, the packets are shown as MPLS packets. You need packet dissector plugins to decode the headers and recognize them.
It is possible to distinguish ANYsec encrypted packets by looking at the Encryption Label in the MPLS header and confirming that it is within the configured ANYsec MPLS label range but this is tedious and a better solution exists.
This solution comes in the form of the ANYsec Packet Dissectors for Wireshark. To start using this dissector, follow the steps outlined in the repo and load the LUA plugins into your Wireshark installation.