SR OS remote logging with Syslog and Loki#
| Activity name | SR OS remote logging with Syslog and Loki |
| Activity ID | 57 |
| Short Description | In this activity you will configure logging on the SR OS nodes and explore the logging stack with Syslog-ng, Promtail, Loki, and Grafana. |
| Difficulty | Beginner |
| Tools used | Grafana Loki Promtail Syslog-ng Nokia YANG Browser Log Events Search Tool |
| Topology Nodes | PE3, Grafana, Promtail, Loki, Syslog-ng |
| References | SR OS Syslog SR OS Log Events Guide |
In today's rapidly evolving network environments, maintaining robust and efficient operations is more critical than ever. Remote logging plays a pivotal role in achieving this by providing a comprehensive and centralized method for monitoring, analyzing, and troubleshooting network activities across diverse and distributed systems.
In the networking field, remote logging using Syslog is a de facto standard way to implement logging. Typically, the network nodes send syslog messages to a centralized syslog collector, and an operator eyeballs the aggregated logs on the collector.
With the proliferation of distributed computing systems, the logging systems had a solid boost both in terms of log collection techniques, aggregation, querying and visualization. Modern logging stacks and services emerged - Logstash, Loki, Datadog, and dozens of cloud-provided logging solutions.
1. Objective#
You are a Network Engineer working on a project to deploy a new network with SR OS nodes. Your team have already installed, configured, and integrated the nodes in the existing network, and the next step before it's ready for production is to integrate the nodes in the management systems. Syslog, for remote logging, is now being configured and you have been asked to complete this work.
In this activity you will test and validate logging configurations on the SR OS nodes and explore a modern logging stack based on Syslog-ng, Loki, Promtail and Grafana. You will discover how to configure remote logging on SR OS and apply various filters to granularly select the messages for logging and verify how modern distributed logging improves the operational experience.
2. Technology explanation#
Events logs are messages generated by the system by applications or processes within the router that provide visibility about the system status.
SR OS Logging is a flexible and powerful architecture illustrated in the Fig. 1 below.
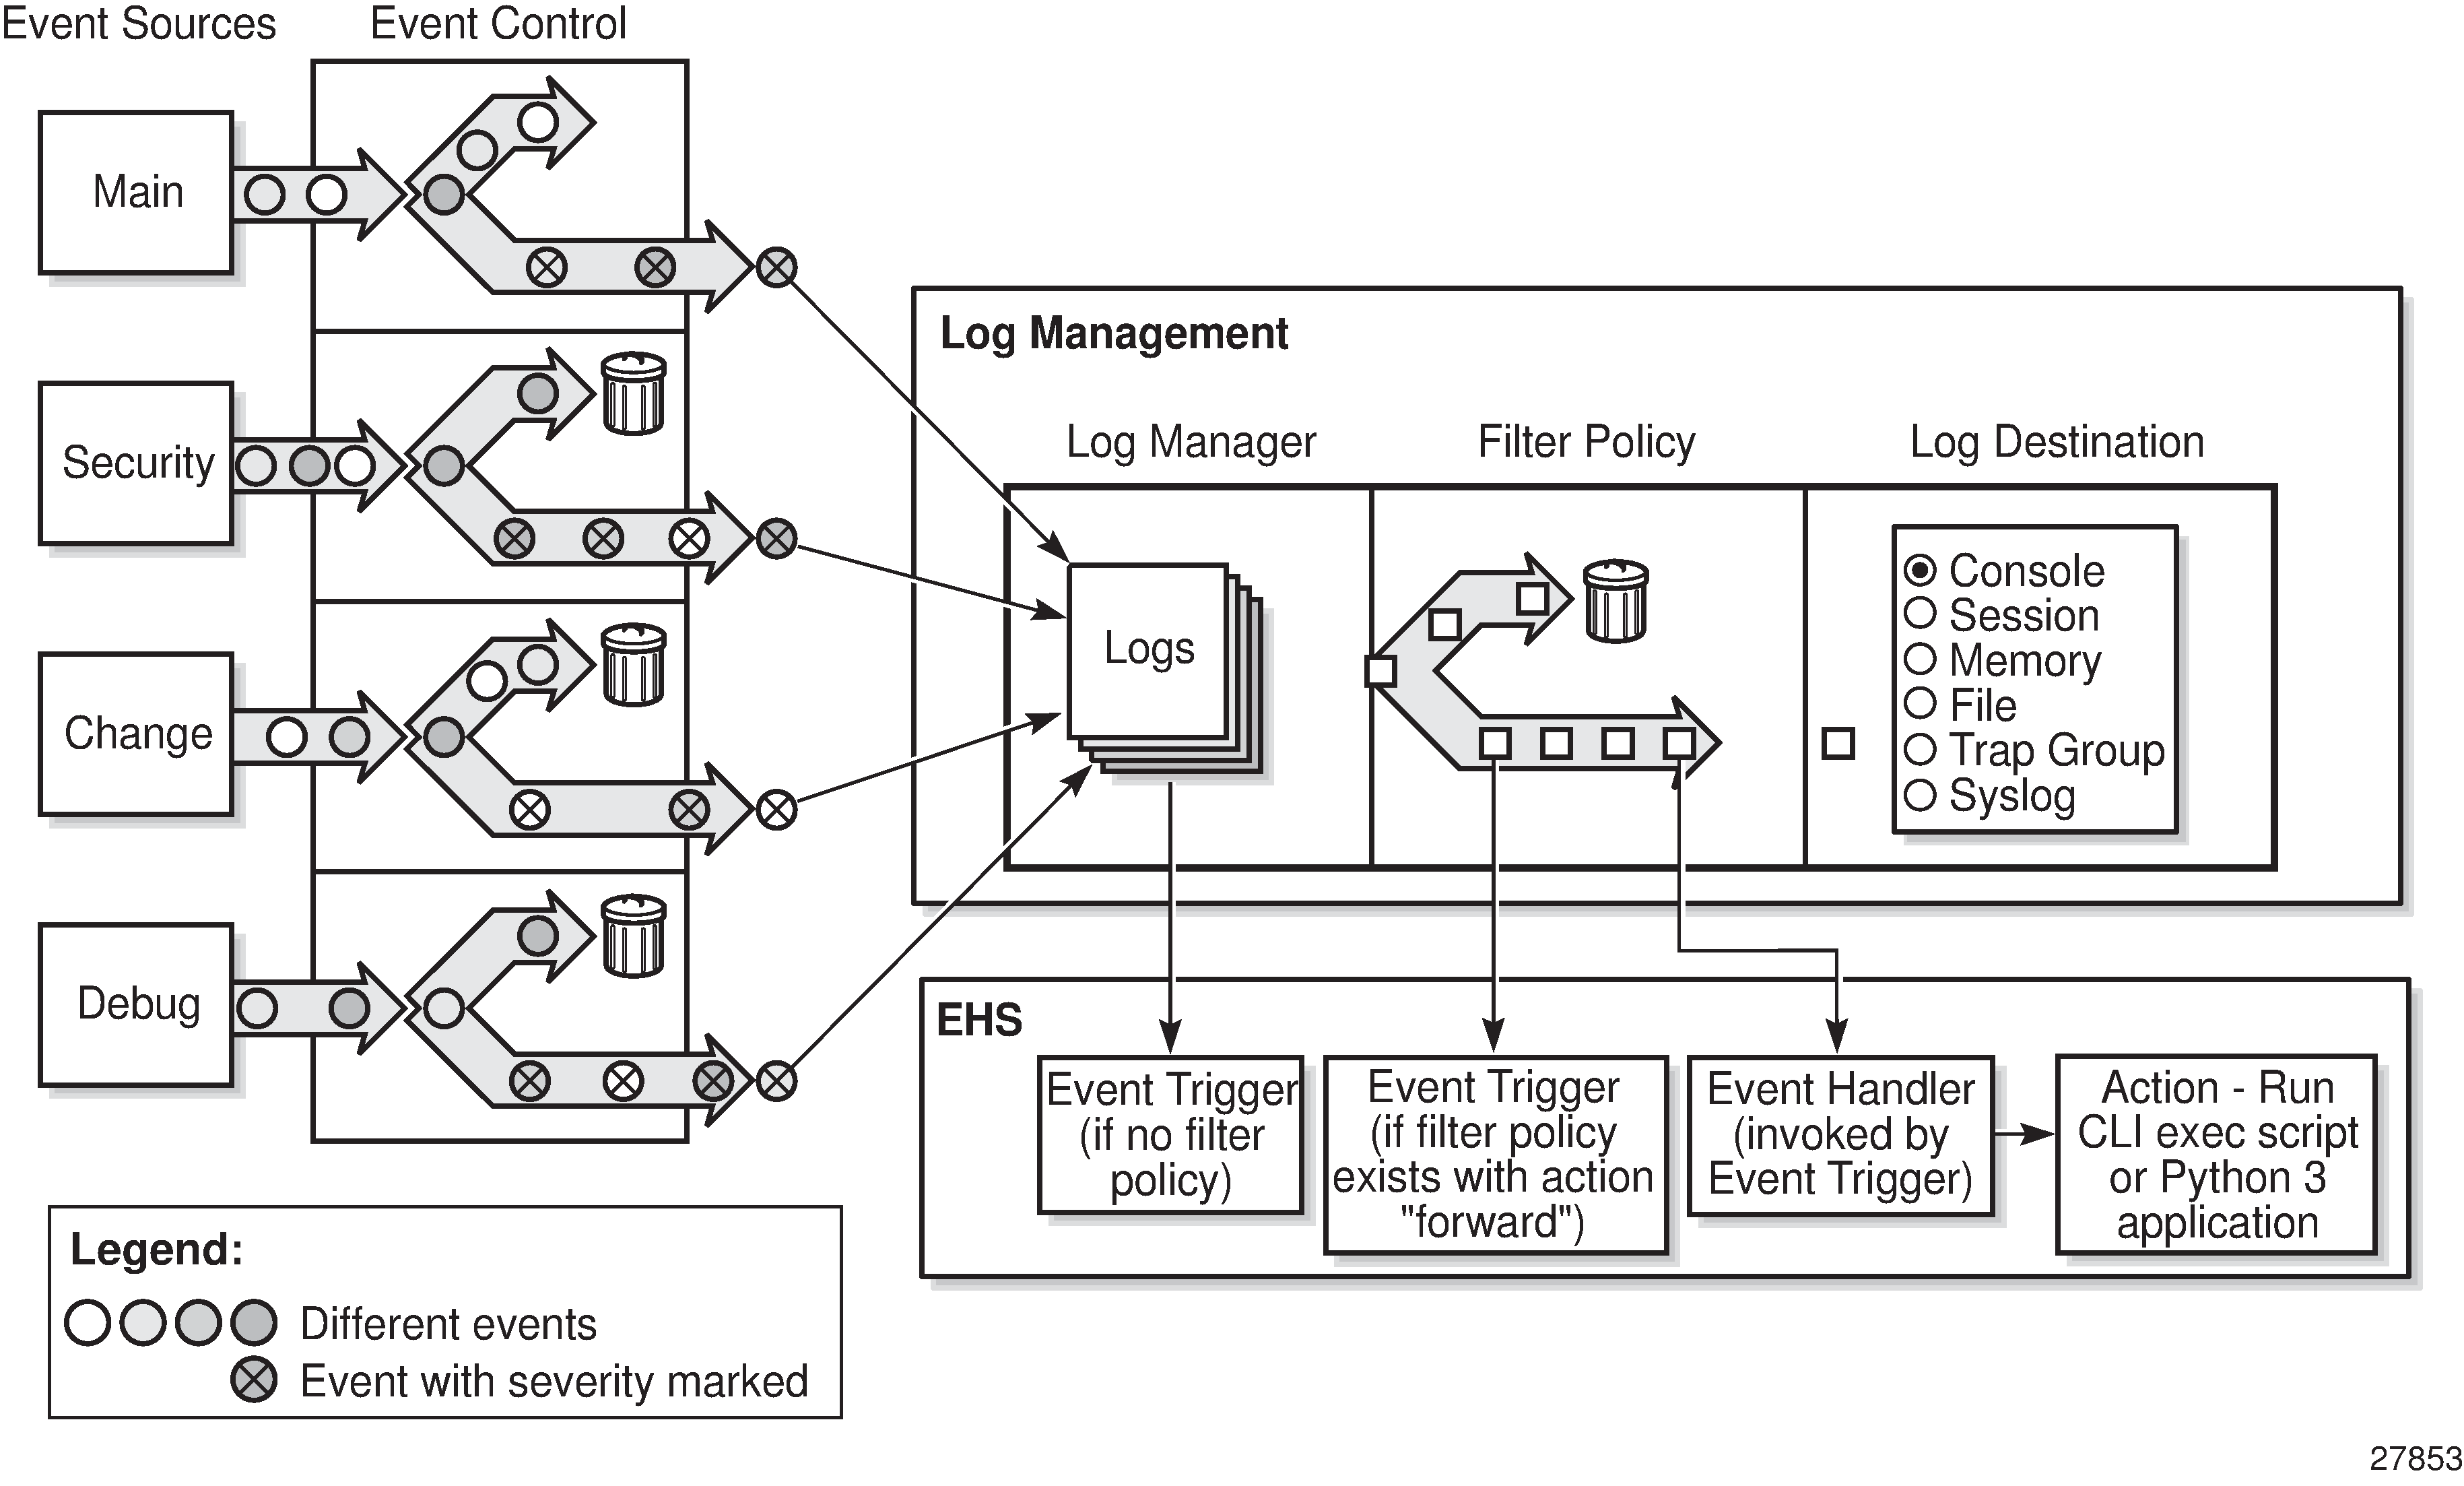
At high level there are four main building blocks: the event sources, the event control, the log management and the Event Handling System (EHS).
- The event sources are the main categories of events that feed the log manager:
security- system security related eventschange- configuration and operation of the systemdebug- debug related eventsli- Lawful interception events from LI applicationmain- all other categories
- Event control pre-processes the events generated by applications before the event is passed to the log manager. Event control assigns a severity to application events and can either forward or suppress the event.
- Events that are forwarded by event control are sent to the log manager. The log manager manages the event logs in the system and the relationships between the log sources, event logs and log destinations, and log filter policies.
- The Event Handling System (EHS) is a framework that allows operator-defined behavior to be configured on the router. EHS adds user-controlled programmatic handling by allowing the execution of either a CLI script or a Python 3 application when a log event (the ‟trigger”) is detected.
SR OS supports several logging destinations such as: console, session, CLI logs, memory logs, log files, SNMP trap group, syslog or NETCONF.
In this activity you will focus on send logging to a remote Syslog destination. The network nodes generate and send syslog to the logging pipeline setup composed of:
- Syslog collector and pre-processor - Syslog-ng
- Log ingestion agent for Loki - Promtail
- A database for central log storage and query engine - Loki
- A visualization tool - Grafana for querying and analyzing data
At a high level, SR OS nodes will send syslog messages to Syslog-ng that collects, parses (according to the format expected by Promtail) and forwards the logs. Promtail normalize the logs and add labels, acting as the bridge between syslog and Loki. Loki receives logs from Promtail, stores logs efficiently indexing labels only (not full log content) and enables queries. Grafana can then query the logs based on the labels assigned to them and allows the visualization with very nice dashboard panels.
3. Tasks#
You should read these tasks from top-to-bottom before beginning the activity.
It is tempting to skip ahead but tasks may require you to have completed previous tasks before tackling them.
3.1 SR OS syslog#
You've been requested to validate the syslog configuration on the nodes and the full logging stack.
Let's start from the beginning of the data pipeline and validate the logging configuration on SR OS nodes.
Start by logging into PE3 node and inspecting the existing logging configurations.
Tip
You can view a summary of the existing logs:
Output:
A:admin@g51-pe3# show log log-id

==============================================================================
Event Logs
==============================================================================
Name
Log  Source   Filter Admin Oper       Logged     Dropped Dest       Dest Size
Id            Id     State State                         Type       Id
------------------------------------------------------------------------------
98
 98  M        N/A    up    up             95           0 syslog     1     N/A
99
 99  M        N/A    up    up            115           1 memory           500
100
100  M        1001   up    up             11         104 memory           500
101
101  M S C    N/A    up    up            430           1 netconf          500
==============================================================================

2026-04-15T11:36:26.28+00:00
(gl)[/show log]
A:admin@g51-pe3#
You can view the configurations under:
Output:
A:admin@g51-pe3# edit-config global
INFO: CLI #2054: Entering global configuration mode

2026-04-15T11:33:20.43+00:00
(gl)[/]
A:admin@g51-pe3# configure log

2026-04-15T11:33:21.98+00:00
(gl)[/configure log]
A:admin@g51-pe3# info
    filter "1001" {
        named-entry "10" {
            description "Collect only events of major severity or higher"
            action forward
            match {
                severity {
                    gte major
                }
            }
        }
    }
    log-id "98" {
        admin-state enable
        description "Default System Log to Syslog"
        source {
            main true
        }
        destination {
            syslog "1"
        }
    }
    log-id "99" {
        admin-state enable
        description "Default System Log"
        source {
            main true
        }
        destination {
            memory {
                max-entries 500
            }
        }
    }
    log-id "100" {
        admin-state enable
        description "Default Serious Errors Log"
        filter "1001"
        source {
            main true
        }
        destination {
            memory {
                max-entries 500
            }
        }
    }
    route-preference {
        primary outband
    }
    syslog "1" {
        description "syslog container"
        address 10.128.51.74
        severity info
        port 5514
        hostname {
            use-system-name { }
        }
    }

2026-04-15T11:33:28.13+00:00
(gl)[/configure log]
A:admin@g51-pe3#
Can you explain the configuration blocks?
In this activity a remote-destination is used to send the log messages to the Syslog-ng service that acts as a Syslog collector and forwarder. Can you identify the configurations to send logs to Syslog-ng?
Solution
Description of the existing configurations:
filter 1001- a log filter that can be applied under log-id's. Currently applied onlog-id 100, which is not relevant for our objective.log-id 98- a log-id instance that captures categorymainevents and forwards them to the syslog server defined as1.route-preference outband- specifies that the routing instance used to reach out remote destinations (eg: syslog servers) should be via out-band (routing-instance"management").syslog 1- the definition of a syslog server (tagged as1). Used as destination inlog-id 98
The syslog "1" context has the required configurations to send logs to Syslog-ng. The log-id "98" uses syslog "1" as destination.
In this example we run as a Group ID: 51 user, so the IP address of the syslog collector is 10.128.51.75. You should see your group ID instead.
    syslog "1" {
        description "syslog container"
        address 10.128.51.74
        severity info
        port 5514
        hostname {
            use-system-name { }
        }
    }
You should notice that the system name is used as the hostname in the logs and all logs with informational level priority and above are sent to the destination.
3.1.1 Local logs#
Local logs use a different format from syslog messages sent to a remote destination. Check the local log IDs 99 and 100 and inspect the messages to compare later with the syslog messages.
Solution
You may look to the existing default memory log-id 99 or 100.
(gl)[/show log]
A:admin@g51-pe3#  show log log-id 99

===============================================================================
Event Log 99 log-name 99
===============================================================================
Description : Default System Log
warning: 1 events dropped from log
Memory Log contents  [size=500   next event=116  (not wrapped)]

115 2026/04/10 16:21:45.072 UTC WARNING: SNMP #2005 vprn300 client03
"Interface client03 is operational"

114 2026/04/10 16:21:45.072 UTC WARNING: SNMP #2005 Base irb
"Interface irb is operational"

113 2026/04/10 16:21:45.072 UTC MAJOR: SVCMGR #2210 Base
"Processing of an access port state change event is finished and the status of all affected SAPs on port 1/1/c6/1 has been updated."

112 2026/04/10 16:21:45.071 UTC WARNING: SNMP #2005 Base 1/1/c6/1
"Interface 1/1/c6/1 is operational"

111 2026/04/10 16:20:44.937 UTC MINOR: LLDP #2101 Base LLDP remote peer added
"LLDP Remote peer added, local port-id 1/1/c3/1, dest-mac-type nearest-bridge, remote system name spine11, remote chassis-id 1A:4D:22:FF:00:00, remote port-id ethernet-1/31, remote-index 4"

110 2026/04/10 16:20:29.259 UTC MINOR: BGP #2019 Base Peer 1: fd00:fde8::51:13
"(ASN 65000) VR 1: Group iBGP-DC: Peer fd00:fde8::51:13: moved into established state"

109 2026/04/10 16:20:21.250 UTC MINOR: BGP #2019 Base Peer 1: fd00:fde8::51:12
"(ASN 65000) VR 1: Group iBGP-CORE: Peer fd00:fde8::51:12: moved into established state"

108 2026/04/10 16:20:20.134 UTC MINOR: BGP #2019 Base Peer 1: fd00:fde8::51:11
"(ASN 65000) VR 1: Group iBGP-CORE: Peer fd00:fde8::51:11: moved into established state"

107 2026/04/10 16:20:18.472 UTC WARNING: ISIS #2045 Base VR:  1 ISIS (0) Adjacency state
"Adjacency status changed to up for interface: p2, for level: l2, LSP-id: 0100.4605.1012.00-00 "

106 2026/04/10 16:20:18.472 UTC WARNING: ISIS #2045 Base VR:  1 ISIS (0) Adjacency state
"Adjacency status changed to initializing for interface: p2, for level: l2, LSP-id: 0100.4605.1012.00-00 "
(...)
A:admin@g51-pe3# show log log-id "100"

===============================================================================
Event Log 100 log-name 100
===============================================================================
Description : Default Serious Errors Log
warning: 109 events dropped from log
Memory Log contents  [size=500   next event=12  (not wrapped)]

11 2026/04/16 22:32:49.289 UTC MAJOR: SVCMGR #2210 Base
"Processing of an access port state change event is finished and the status of all affected SAPs on port 1/1/c6/1 has been updated."

10 2026/04/16 22:31:05.980 UTC MAJOR: SYSTEM #2005 Base SNMP daemon
"SNMP daemon initialization complete.
System configured with persistent SNMP indexes: true.
SNMP daemon administrative status: inService.
SNMP daemon operational status: inService."

9 2026/04/16 22:31:05.980 UTC MAJOR: SYSTEM #2023 Base Main: SNMP operationally up
"The SNMP agent has changed state.  Administrative state is inService and operational state is inService."

8 2026/04/16 22:31:05.891 UTC MAJOR: SYSTEM #2004 Base System configured
"Bootup configuration complete. Configuration status: configOK.
SNMP Persistent Indexes status: persistOK.
System configured with persistent indexes: true."
(...)
3.1.2 Log message capture#
To see the messages on the wire as they are being sent towards a remote syslog collector you can capture the packets from clab-srexperts-syslog on port eth0.
Note
You may use Edgeshark (WebUI or from VSCode) or TCPDump/TShark from your hackathon instance host. For more details about the capture options refer to tools guide Containerlab capture traffic .
From your hackathon instance host, start a packet capture at clab-srexperts-syslog and trigger logs on the router. You may filter the packets by port 5514.
Question: How to trigger logs?
There are many options to trigger logs, for example:
- login or logout the router
- change configurations or execute a
commit - enable/disable an interface remotely with
gnmic - ...
You may also manually trigger specific logs with tools command. We will explore this option later in this activity.
For now, use one of the other options, for example use the following gnmic from your hackathon instance and you will observe many logs.
# Original Status
gnmic -a clab-srexperts-pe3:57400 -u admin -p $EVENT_PASSWORD --insecure get --path '/configure/port[port-id=1/1/c1/1]/admin-state' | grep -e enable -e disable
# Disable
gnmic -a clab-srexperts-pe3:57400 -u admin -p $EVENT_PASSWORD --insecure set --update-path '/configure/port[port-id=1/1/c1/1]/admin-state' --update-value disable
# Enable
gnmic -a clab-srexperts-pe3:57400 -u admin -p $EVENT_PASSWORD --insecure set --update-path '/configure/port[port-id=1/1/c1/1]/admin-state' --update-value enable
# Final status
gnmic -a clab-srexperts-pe3:57400 -u admin -p $EVENT_PASSWORD --insecure get --path '/configure/port[port-id=1/1/c1/1]/admin-state' | grep -e enable -e disable
Outputs: Packet capture
You may use TShark or TCPDump from your hackathon instance.
Output
bash# sudo ip netns exec clab-srexperts-syslog tshark -l -i eth0  -f "port 5514"
Running as user "root" and group "root". This could be dangerous.
Capturing on 'eth0'
    1 0.000000000 10.128.51.23 → 10.128.51.74 Syslog 164 LOCAL7.WARNING: Apr 17 17:00:49 g51-pe3 TMNX: 169 Base SNMP-WARNING-linkDown-2004 [1/1/c1/1]:  Interface 1/1/c1/1 is not operational\n
    2 0.000374060 10.128.51.23 → 10.128.51.74 Syslog 152 LOCAL7.WARNING: Apr 17 17:00:49 g51-pe3 TMNX: 170 Base SNMP-WARNING-linkDown-2004 [p1]:  Interface p1 is not operational\n
    3 0.000909560 10.128.51.23 → 10.128.51.74 Syslog 218 LOCAL7.WARNING: Apr 17 17:00:49 g51-pe3 TMNX: 171 Base RSVP-WARNING-vRtrRsvpIfStateChange-2002 [VR 1:]:  Interface p1 is in administrative state inService, operational state outOfService\n
    4 0.000930501 10.128.51.23 → 10.128.51.74 Syslog 220 LOCAL7.WARNING: Apr 17 17:00:49 g51-pe3 TMNX: 172 Base MPLS-WARNING-vRtrMplsIfStateChange-2008 [VR 1:]:  Interface p1 is in administrative state: inService, operational state: outOfService\n
    5 0.000942853 10.128.51.23 → 10.128.51.74 Syslog 227 LOCAL7.ERR: Apr 17 17:00:49 g51-pe3 TMNX: 173 Base MPLS-MINOR-vRtrMplsIfIPv6StateChange-2032 [VR 1:]:  Interface p1 is in administrative state: inService, IPv6 operational state: outOfService\n
    6 0.000986667 10.128.51.23 → 10.128.51.74 Syslog 262 LOCAL7.WARNING: Apr 17 17:00:49 g51-pe3 TMNX: 174 Base ISIS-WARNING-tmnxIsisAdjacencyChange-2045 [VR:  1 ISIS (0) Adjacency state ]:  Adjacency status changed to down for interface: p1, for level: l2, LSP-id: 0100.4605.1011.00-00 \n
    7 0.002411348 10.128.51.23 → 10.128.51.74 Syslog 268 LOCAL7.WARNING: Apr 17 17:00:49 g51-pe3 TMNX: 175 Base SYSTEM-WARNING-ssiSaveIncrementConfigSucceeded-2110 [Configuration Save Succeeds]:  Incremental configuration file saved to: cf3:\.commit-history\config-2026-04-17T17-00-49.3Z-10.is\n
(...)
Output
bash# sudo ip netns exec clab-srexperts-syslog tcpdump -nnv  port 5514
dropped privs to tcpdump
tcpdump: listening on eth0, link-type EN10MB (Ethernet), snapshot length 262144 bytes
12:54:28.309700 IP (tos 0x88, ttl 64, id 9378, offset 0, flags [none], proto UDP (17), length 253)
    10.128.51.23.514 > 10.128.51.74.5514: SYSLOG, length: 225
        Facility local7 (23), Severity warning (4)
        Msg: Apr 17 16:54:28 g51-pe3 TMNX: 155 Base SYSTEM-WARNING-ssiSaveIncrementConfigSucceeded-2110 [Configuration Save Succeeds]:  Incremental configuration file saved to: cf3:\.commit-history\config-2026-04-17T16-54-28.3Z-9.is^J
12:54:28.420530 IP (tos 0x88, ttl 64, id 9379, offset 0, flags [none], proto UDP (17), length 144)
    10.128.51.23.514 > 10.128.51.74.5514: SYSLOG, length: 116
        Facility local7 (23), Severity warning (4)
        Msg: Apr 17 16:54:28 g51-pe3 TMNX: 156 Base SNMP-WARNING-linkUp-2005 [1/1/c1/1]:  Interface 1/1/c1/1 is operational^J
12:54:28.420575 IP (tos 0x88, ttl 64, id 9380, offset 0, flags [none], proto UDP (17), length 132)
    10.128.51.23.514 > 10.128.51.74.5514: SYSLOG, length: 104
        Facility local7 (23), Severity warning (4)
        Msg: Apr 17 16:54:28 g51-pe3 TMNX: 157 Base SNMP-WARNING-linkUp-2005 [p1]:  Interface p1 is operational^J
(...)
Question: Logout and login at PE3 and observe the generated syslog messages. Do you see the syslog messages?
No, you should not see any syslog messages because login/logout are security events and the syslog configuration only includes the main event stream.
In the output below the log-id 98 only has the source flag "M" (Main event source).
*(gl)[/configure log log-id "98"]
A:admin@g3-pe3# show log log-id

==============================================================================
Event Logs
==============================================================================
Name
Log  Source   Filter Admin Oper       Logged     Dropped Dest       Dest Size
Id            Id     State State                         Type       Id
------------------------------------------------------------------------------
98
 98  M        N/A    up    up           4289           0 syslog     1     N/A
99
 99  M        N/A    up    up           4309           0 memory           500
100
100  M        1001   up    up             11        4298 memory           500
101
101  M S C    N/A    up    up          56755           0 netconf          500
==============================================================================

2026-05-08T11:43:10.11+00:00
*(gl)[/configure log log-id "98"]
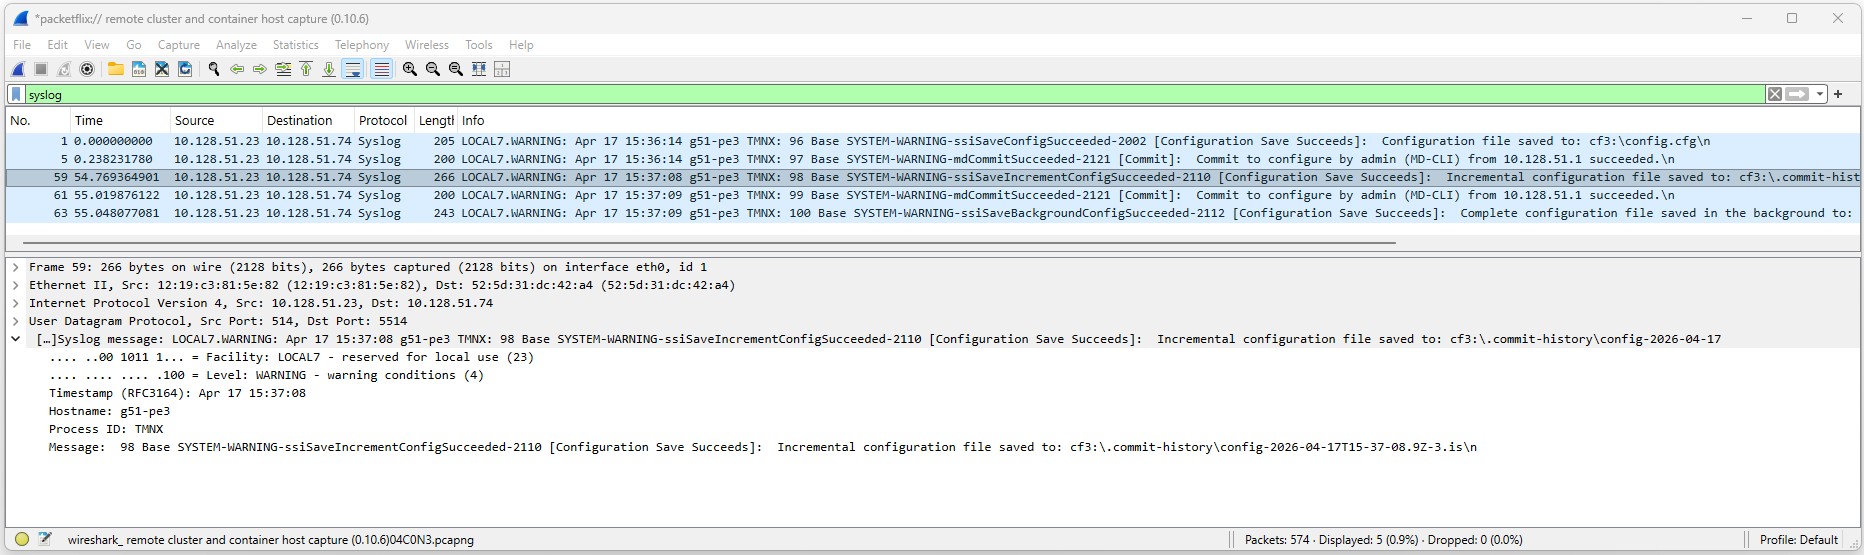
The Fig.2 below shows the wireshark output using Edgeshark for syslog capture.
Change the PE3 configurations to include Security and Change event sources.
Repeat the test and observe the syslog messages in the packet capture.
Solution
Change the configuration to include the security event stream as shown below.
The output must show the "M", "S" and "C" flags for log-id 98.
(gl)[/configure log log-id "98"]
A:admin@g3-pe3# show log log-id

==============================================================================
Event Logs
==============================================================================
Name
Log  Source   Filter Admin Oper       Logged     Dropped Dest       Dest Size
Id            Id     State State                         Type       Id
------------------------------------------------------------------------------
98
 98  M S C    N/A    up    up           4869           0 syslog     1     N/A
99
 99  M        N/A    up    up           4375           0 memory           500
100
100  M        1001   up    up             11        4364 memory           500
101
101  M S C    N/A    up    up          57548           0 netconf          500
==============================================================================

2026-05-08T14:34:56.13+00:00
(gl)[/configure log log-id "98"]
Repeat the test to confirm that login and logout security messages are now being sent to syslog
bash$ sudo ip netns exec clab-srexperts-syslog tshark -l -i eth0  -f "port 5514 and host 10.128.3.23"
Running as user "root" and group "root". This could be dangerous.
Capturing on 'eth0'
    1 0.000000000  10.128.3.23 → 10.128.3.74  Syslog 176 LOCAL7.ERR: May  8 11:55:00 g3-pe3 TMNX: 4333 management SECURITY-MINOR-ssh_user_logout-2010 [admin]:  User admin from 10.128.3.1 logged out\n
    2 4.372069365  10.128.3.23 → 10.128.3.74  Syslog 174 LOCAL7.ERR: May  8 11:55:04 g3-pe3 TMNX: 4334 management SECURITY-MINOR-ssh_user_login-2009 [admin]:  User admin from 10.128.3.1 logged in\n
^C2 packets captured
3.2 Syslog-ng#
Now you are at a point when a raw syslog message has been generated by SR OS and sent towards its first stop - Syslog-ng. The Syslog-ng is used as an intermediate log processor, it receives the SR OS syslog messages, parses the message content, rewrites and forwards the enriched logs to Promtail.
Inspect the Syslog-ng configuration file and try to interpret each section.
You can find the Syslog-ng configuration file at:
Output: Syslog-ng configuration file
This is the full Syslog-ng configuration file
#############################################################################
# Default syslog-ng.conf file which collects all local logs into a
# single file called /var/log/messages tailored to container usage.

@version: 4.2
@include "scl.conf"

options {
    keep-hostname(yes);
    chain-hostnames(no);
};

# filter process in MESSAGE field and store in variable $1
filter f_filter { match('Base ([A-Z]+)-' value("MESSAGE") flags("store-matches")); };
# rewrite PROGRAM field
rewrite r_rewrite_set{
    set("$1", value("PROGRAM") condition(filter(f_filter)));
};
# Source - SROS Nodes
source s_network_udp {
  network(transport(udp) port(5514));
};
# Destination - Promtail
destination d_promtail {
  syslog("promtail" transport("udp") port(1514));
};
# Destination - local
destination d_local {
  file("/var/log/messages");
};
# Receives, rewrite and send to destinations
log {
  source(s_network_udp);
  rewrite(r_rewrite_set);
  destination(d_local);
  destination(d_promtail);
};
Can you describe what Syslog-ng is doing?
Solution: Syslog-ng
In this setup, syslog-ng:
- receives the raw syslog messages from SR OS
- parses the message content using regex
- extracts useful information (for example BGP, ISIS, MPLS)
- rewrites the PROGRAM field with that extracted value
- forwards the enriched logs to Promtail and to a local log
This allows Promtail and Loki to create meaningful labels and enables better filtering and dashboards in Grafana.
From your hackathon instance host, start a new packet capture at clab-srexperts-syslog, apply a filter to capture both logs received from SR OS nodes and sent to Promtail. Trigger log events on the router as in the previous task.
sudo ip netns exec clab-srexperts-syslog tshark -l -i eth0 -f "port 1514 or 5514" -d udp.port=1514,syslog
Notice the packets received from the SR OS nodes are modified by Syslog-ng and then sent to Promtail. This parsing is required to ensure the logs are in the format expected by Promtail.
Output details: Packet capture
Besides TShark and TCPDump you may use VSCode or Edgeshark WebUI for packet captures.
For details about the packet capture options refer to tools guide Containerlab capture traffic .
Capture both ports 5514 (from SR OS) and port 1514 (to Promtail).
sudo ip netns exec clab-srexperts-syslog tshark -l -i eth0 -f "port 1514 or 5514" -d udp.port=1514,syslog
Output:
$ sudo ip netns exec clab-srexperts-syslog tshark -l -i eth0 -f "port 1514 or 5514" -d udp.port=1514,syslog
Running as user "root" and group "root". This could be dangerous.
tshark: WARNING: -d requires "==" instead of "=". Option will be treated as "udp.port==1514,syslog"
Capturing on 'eth0'
    1 0.000000000  10.128.3.21 → 10.128.3.74  Syslog 267 LOCAL7.WARNING: May  8 15:13:50 g3-pe1 TMNX: 67158 Base BGP-WARNING-bgpPeerNotFound-2012 [PEER 1: fd00:fc00:0:51::3]:  (ASN 0) PEER 1: fd00:fc00:0:51::3: Closing connection: PEER 1: fd00:fc00:0:51::3 not enabled or not in configuration\n
    2 0.000657453  10.128.3.74 → 10.128.3.75  Syslog 283 LOCAL7.WARNING: 1 2026-05-08T15:13:50+00:00 g3-pe1 BGP - - - 67158 Base BGP-WARNING-bgpPeerNotFound-2012 [PEER 1: fd00:fc00:0:51::3]:  (ASN 0) PEER 1: fd00:fc00:0:51::3: Closing connection: PEER 1: fd00:fc00:0:51::3 not enabled or not in configuration\n
    3 9.935694295  10.128.3.22 → 10.128.3.74  Syslog 255 LOCAL7.WARNING: May  8 15:14:00 g3-pe2 TMNX: 4359 Base SYSTEM-WARNING-tmnxSysNtcnfListenOperStateChngd-2123 [Oper state changed]:  Listening NETCONF server oper-state changed to inService with oper-down reason notApplicable\n
    4 9.936026016  10.128.3.74 → 10.128.3.75  Syslog 274 LOCAL7.WARNING: 1 2026-05-08T15:14:00+00:00 g3-pe2 SYSTEM - - - 4359 Base SYSTEM-WARNING-tmnxSysNtcnfListenOperStateChngd-2123 [Oper state changed]:  Listening NETCONF server oper-state changed to inService with oper-down reason notApplicable\n
    5 9.936317085  10.128.3.23 → 10.128.3.74  Syslog 181 LOCAL7.ERR: May  8 15:14:00 g3-pe3 TMNX: 5047 management SECURITY-MINOR-netconf_user_login-2121 [admin]:  User admin from 192.168.6.102 logged in\n
    6 9.936529649  10.128.3.23 → 10.128.3.74  Syslog 179 LOCAL7.ERR: May  8 15:14:00 g3-pe3 TMNX: 5048 management USER-MINOR-netconf_user_login-2018 [admin]:  Netconf user from 192.168.6.102 logged in\n
    7 9.936646018  10.128.3.74 → 10.128.3.75  Syslog 198 LOCAL7.ERR: 1 2026-05-08T15:14:00+00:00 g3-pe3 TMNX - - - 5047 management SECURITY-MINOR-netconf_user_login-2121 [admin]:  User admin from 192.168.6.102 logged in\n
    8 9.936832139  10.128.3.74 → 10.128.3.75  Syslog 196 LOCAL7.ERR: 1 2026-05-08T15:14:00+00:00 g3-pe3 TMNX - - - 5048 management USER-MINOR-netconf_user_login-2018 [admin]:  Netconf user from 192.168.6.102 logged in\n
    9 9.959304563  10.128.3.23 → 10.128.3.74  Syslog 223 LOCAL7.ERR: May  8 15:14:00 g3-pe3 TMNX: 5049 management SECURITY-MINOR-netconf_auth-2227 [admin]:  User admin from 192.168.6.102 port 16000 to port 830 session 7497: hello RPC authorized\n
   10 9.959529152  10.128.3.74 → 10.128.3.75  Syslog 240 LOCAL7.ERR: 1 2026-05-08T15:14:00+00:00 g3-pe3 TMNX - - - 5049 management SECURITY-MINOR-netconf_auth-2227 [admin]:  User admin from 192.168.6.102 port 16000 to port 830 session 7497: hello RPC authorized\n
   11 9.975511200  10.128.3.22 → 10.128.3.74  Syslog 262 LOCAL7.WARNING: May  8 15:14:00 g3-pe2 TMNX: 4360 Base SYSTEM-WARNING-tmnxSysNtcnfListenOperStateChngd-2123 [Oper state changed]:  Listening NETCONF server oper-state changed to outOfService with oper-down reason noConnectedClient\n
   12 9.975770572  10.128.3.74 → 10.128.3.75  Syslog 281 LOCAL7.WARNING: 1 2026-05-08T15:14:00+00:00 g3-pe2 SYSTEM - - - 4360 Base SYSTEM-WARNING-tmnxSysNtcnfListenOperStateChngd-2123 [Oper state changed]:  Listening NETCONF server oper-state changed to outOfService with oper-down reason noConnectedClient\n
   13 9.980851150  10.128.3.23 → 10.128.3.74  Syslog 237 LOCAL7.ERR: May  8 15:14:00 g3-pe3 TMNX: 5050 management SECURITY-MINOR-netconf_auth-2227 [admin]:  User admin from 192.168.6.102 port 16000 to port 830 session 7497: create-subscription RPC authorized\n
   14 9.981050323  10.128.3.74 → 10.128.3.75  Syslog 254 LOCAL7.ERR: 1 2026-05-08T15:14:00+00:00 g3-pe3 TMNX - - - 5050 management SECURITY-MINOR-netconf_auth-2227 [admin]:  User admin from 192.168.6.102 port 16000 to port 830 session 7497: create-subscription RPC authorized\n
   15 10.135533881  10.128.3.22 → 10.128.3.74  Syslog 255 LOCAL7.WARNING: May  8 15:14:00 g3-pe2 TMNX: 4361 Base SYSTEM-WARNING-tmnxSysNtcnfListenOperStateChngd-2123 [Oper state changed]:  Listening NETCONF server oper-state changed to inService with oper-down reason notApplicable\n
   16 10.135971812  10.128.3.74 → 10.128.3.75  Syslog 274 LOCAL7.WARNING: 1 2026-05-08T15:14:00+00:00 g3-pe2 SYSTEM - - - 4361 Base SYSTEM-WARNING-tmnxSysNtcnfListenOperStateChngd-2123 [Oper state changed]:  Listening NETCONF server oper-state changed to inService with oper-down reason notApplicable\n
   17 10.189080221  10.128.3.23 → 10.128.3.74  Syslog 183 LOCAL7.ERR: May  8 15:14:00 g3-pe3 TMNX: 5051 management SECURITY-MINOR-netconf_user_logout-2122 [admin]:  User admin from 192.168.6.102 logged out\n
   18 10.189211073  10.128.3.23 → 10.128.3.74  Syslog 181 LOCAL7.ERR: May  8 15:14:00 g3-pe3 TMNX: 5052 management USER-MINOR-netconf_user_logout-2019 [admin]:  Netconf user from 192.168.6.102 logged out\n
   19 10.189353745  10.128.3.74 → 10.128.3.75  Syslog 200 LOCAL7.ERR: 1 2026-05-08T15:14:00+00:00 g3-pe3 TMNX - - - 5051 management SECURITY-MINOR-netconf_user_logout-2122 [admin]:  User admin from 192.168.6.102 logged out\n
   20 10.189384319  10.128.3.74 → 10.128.3.75  Syslog 198 LOCAL7.ERR: 1 2026-05-08T15:14:00+00:00 g3-pe3 TMNX - - - 5052 management USER-MINOR-netconf_user_logout-2019 [admin]:  Netconf user from 192.168.6.102 logged out\n
<...>
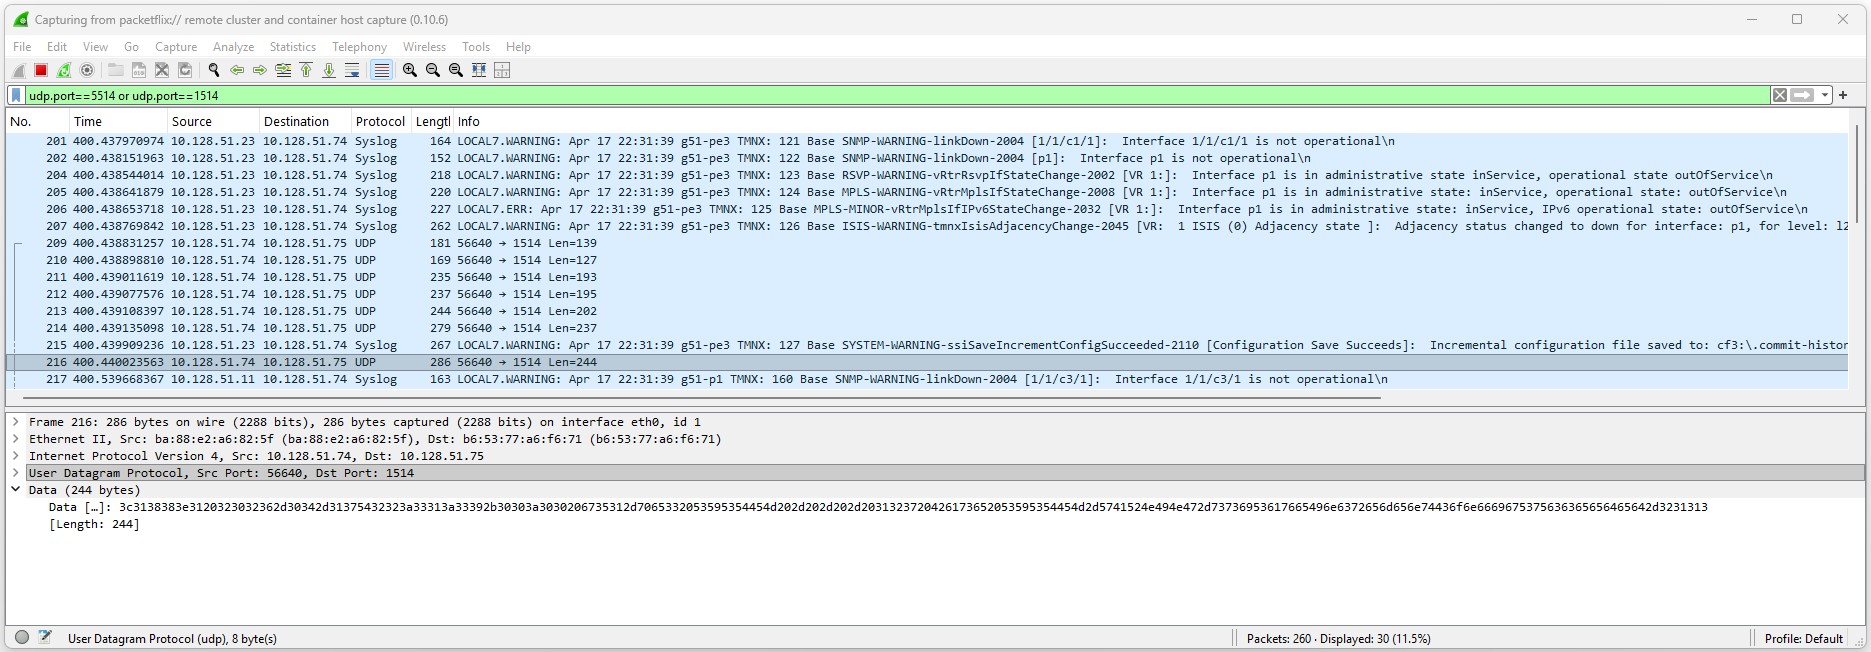
The Fig.3 below shows the wireshark output using Edgeshark for syslog between Syslog-ng and Promtail.
Note that udp port 5514 packets are decoded whereas udp port 1514 packets are not decoded. You need to instruct Wireshark to decode it as syslog:
- Right-click the packet and select Decode As....
- Configure Rule:
- In the "Decode As" dialog box, under the Field column select "UDP port" and Value "1514".
- Under the Current column, scroll down or type "SYSLOG" to find and select SYSLOG.
- Click OK or Apply
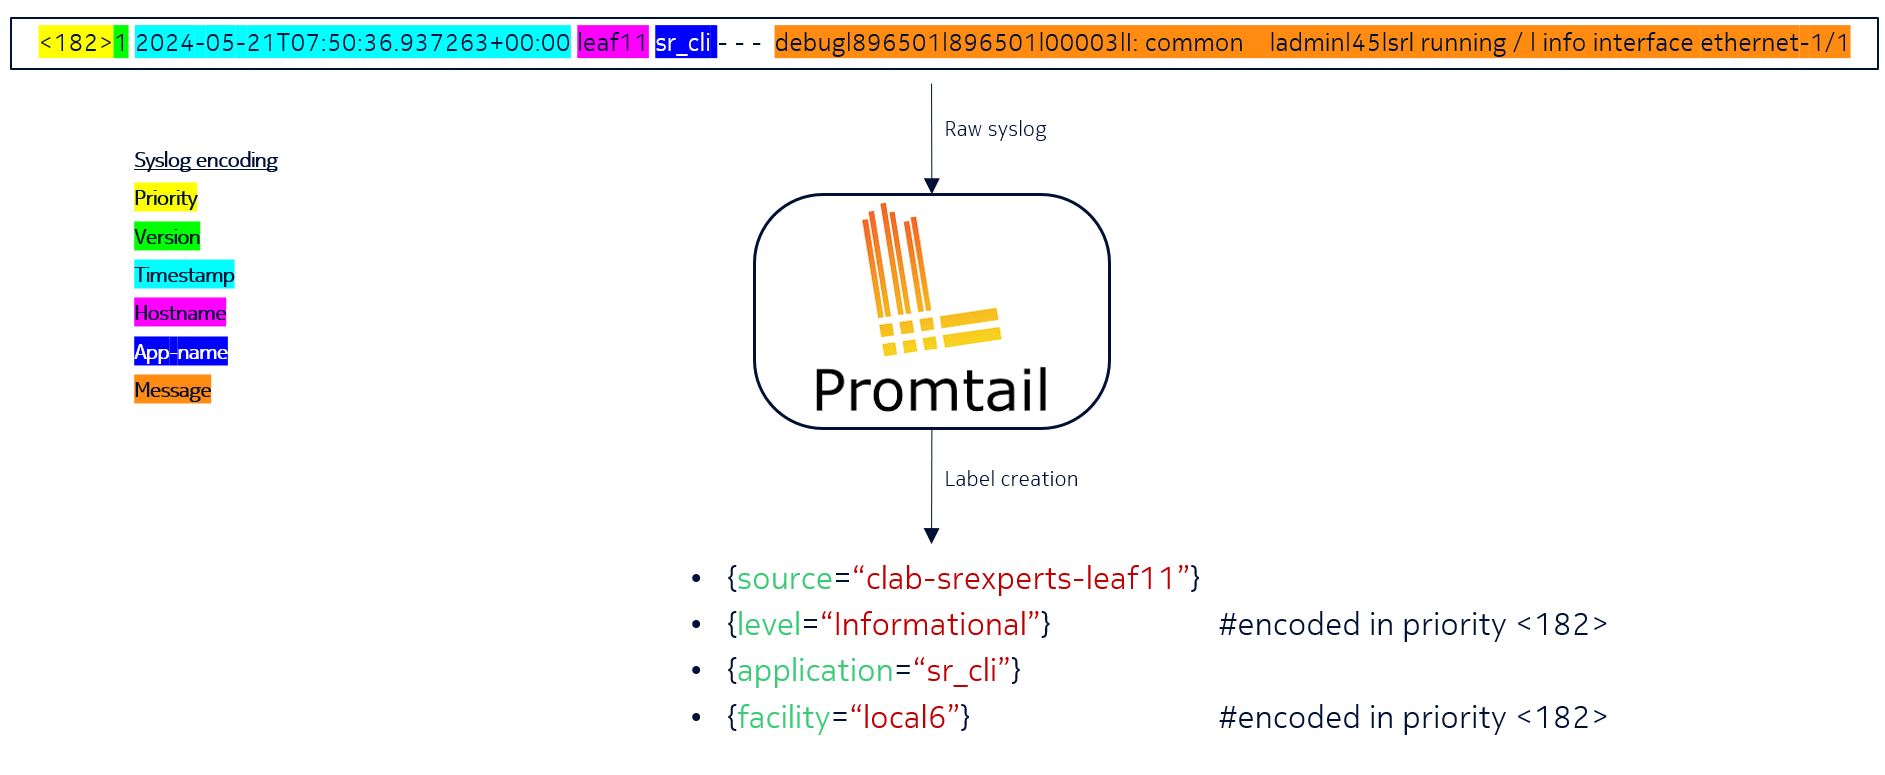
3.3 Promtail#
Promtail will take the syslog messages from Syslog-ng and generate additional labels associated with the log entry. The log processing/transformation is a very important process, it allows you to enrich, parse and tune the log messages before they are sent to the log collector.
Inspect the Promtail configuration file and try to interpret each section.
You can find the Promtail configuration file at:
Output: Promtail configuration file
This is the full Promtail configuration file
# Copyright 2023 Nokia
# Licensed under the BSD 3-Clause License.
# SPDX-License-Identifier: BSD-3-Clause

clients:
  - url: http://loki:3100/loki/api/v1/push

scrape_configs:
  - job_name: syslog
    syslog:
      listen_address: 0.0.0.0:1514
      listen_protocol: udp
      idle_timeout: 300s
      label_structured_data: yes
      labels:
        job: "syslog"
    relabel_configs:
      - source_labels: ["__syslog_message_hostname"]
        replacement: clab-srexperts-$1
        target_label: "source"
        regex: (?:g\d+)-([a-z]+\d+|vRR)
      - source_labels: ["__syslog_message_severity"]
        target_label: "level"
      - source_labels: ["__syslog_message_app_name"]
        target_label: "application"
      - source_labels: ["__syslog_message_facility"]
        target_label: "facility"
      - source_labels: ["__syslog_message_proc_id"]
        target_label: "procid"
Can you describe what each section is doing?
Solution: Promtail configuration break down.
Have a closer look at each section.
This section specifies where Promtail should send the logs to. In this case, it's sending logs to a Loki instance, by referring to its DNS name. The loki name is resolved by docker to the associated IP address of the Loki container.
Next, we define Promtail to be used as a syslog collector. It listens on all IP addresses (including "10.128.${INSTANCE_ID}.75") on UDP port 1514 and generates a static label job: syslog which will be applied to all log entries.
relabel_configs is used to manipulate or add labels to the log entries. These labels can be very useful when querying them from the Loki database. In the example below we manipulate only one label - the source label.
source_labels extracts a value from the specified field in the syslog message, in this case the hostname, and replaces it with clab-srexperts-$1 and applies it to the target_label source.
Besides altering the value for the source label, we also use the values from the syslog internal values (for example __syslog_message_severity) and apply the value to a label with a more human-friendly name level.
scrape_configs:
    #<snippet>
    relabel_configs:
      - source_labels: ["__syslog_message_hostname"]
        replacement: clab-srexperts-$1
        target_label: "source"
      - source_labels: ["__syslog_message_severity"]
        target_label: "level"
      - source_labels: ["__syslog_message_app_name"]
        target_label: "application"
      - source_labels: ["__syslog_message_facility"]
        target_label: "facility"
      - source_labels: ["__syslog_message_proc_id"]
        target_label: "procid"
3.4 Loki#
Time to open up Loki and query some logs based on the label created by Promtail.
Open Grafana UI on your laptop use the following address: http://<group-id>.srexperts.net:3000
Log into the Grafana dashboard with admin/${EVENT_PASSWORD} credentials.
With Grafana UI loaded:
- Use the
Menuon the left - Click on
Explore - Select
Lokias data source on the top left corner (by defaultPrometheusis selected) - In
Label filterselect labelsourceand select value as one of the SR OS nodes, for example PE3 - Click blue button titled
Run queryin the right corner - You should now see all the logs related to the node PE3
- Add a extra search label by clicking on
+next to your existing label filter - In
Label filterselect labelapplicationand select one option from select value dropdown, for exampleSNMP - Click
Run queryagain. You may change the time range to see more logs. - You should now see all CLI log messages sourced from the node and application you selected.
You may explore other options such as filtering with expressions present in the log message.
3.5 Grafana#
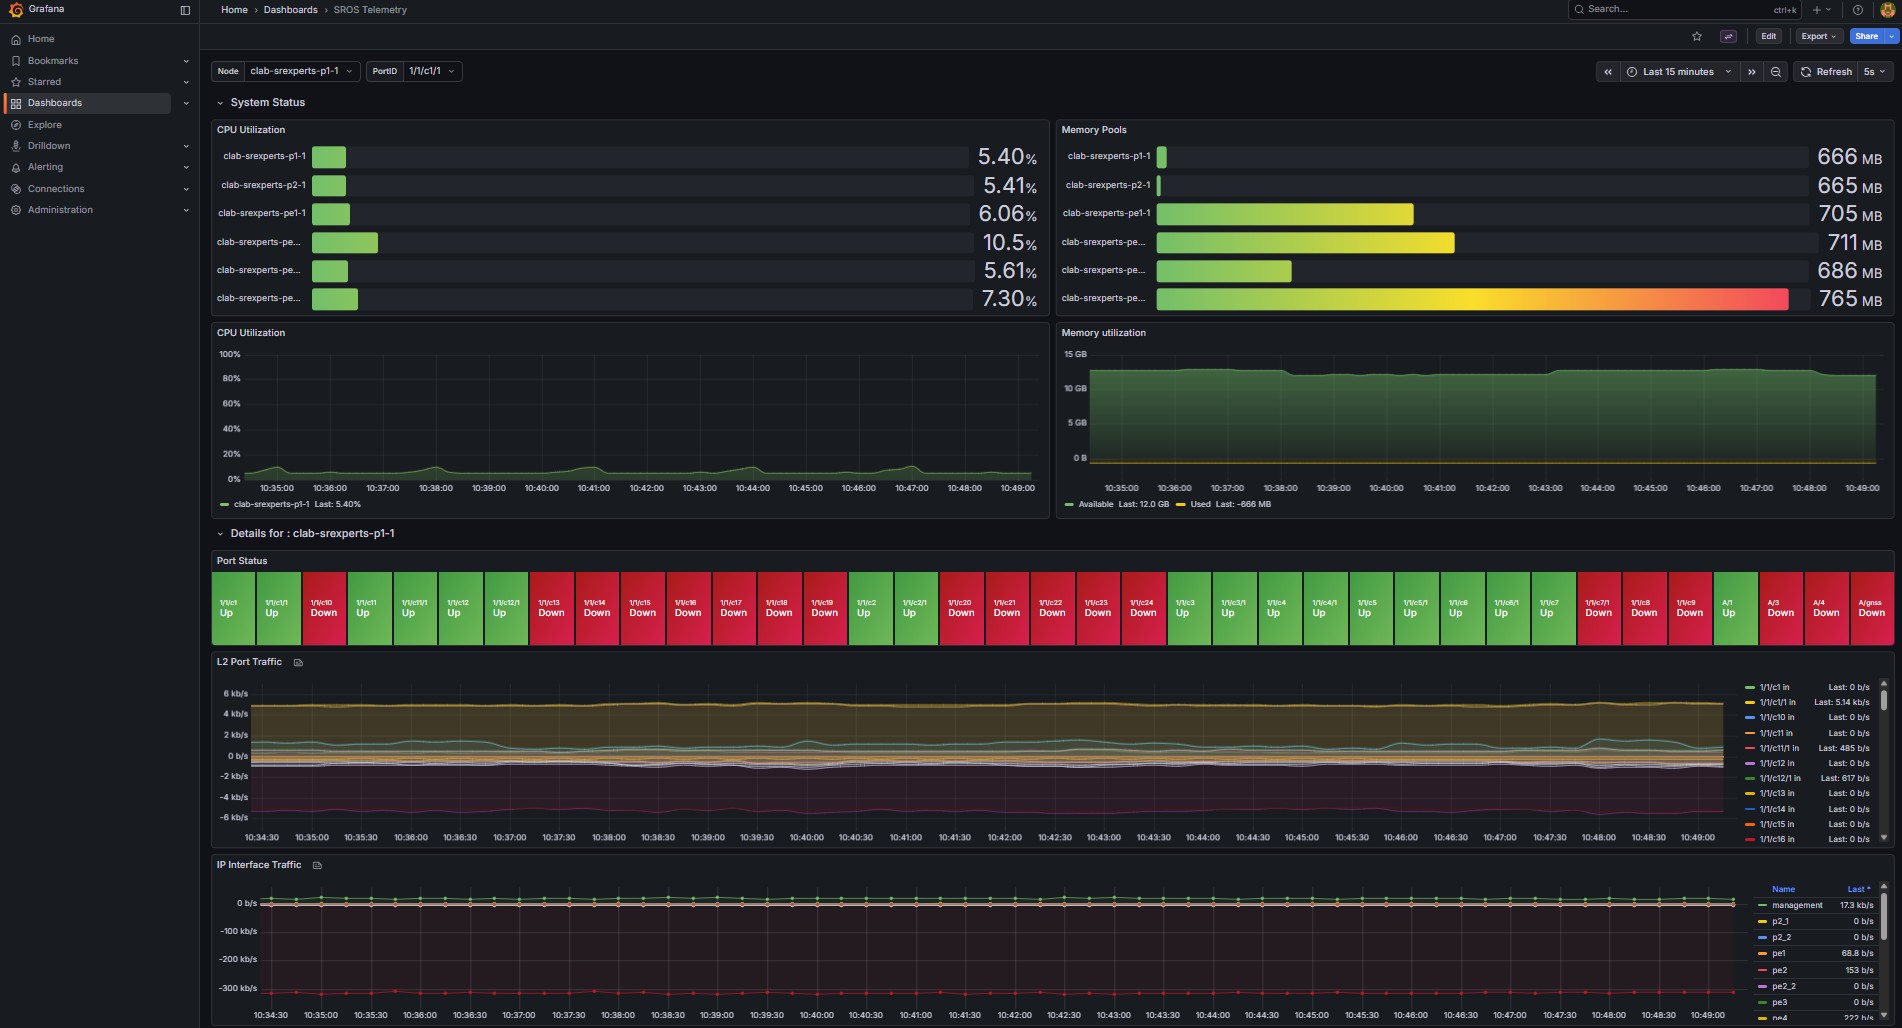
You can now create Grafana dashboards to provide custom visualizations, using your Loki logs. Have a look at the SR OS Telemetry dashboard.
- Try to add a dashboard to Grafana displaying log messages for a given subsystem.
Tip: Add Grafana dashboard
There's already a Syslog dashboard with several display panels that you may use as reference.
Create a new dashboard and then add panels following the guidelines below.
Create a new dashboard named "SROS_Syslog":
- Select
Dashboardsfrom the menu on the left - Select
Newon the right andNew Dashboard - Click
+ Add visualizationand selectLoki - Click
Save dashboardon the top right corner and set the titleSROS_Syslog
You need to create variables that you will use later to filter the logs.
- Select
Back to dashboard - Click
Settingsand selectvariables - Click
Add variableand create a variable with the following parameters- Name: NE
- Data source: Loki
- Query type: Label values
- Label: source
- Scroll down and hit
Run queryto confirm it returns the nodes - Click
Back to list - Click
New variableand create a variable with the following parameters- Name: Logs
- Data source: Loki
- Query type: Label values
- Label: application
- Scroll down and hit
Run queryto confirm it returns the applications - Click
Back to listand thenBack to dashboard
Add 3 visualizations panels (Add=>Visualization) with the following configurations. Note: To make it easier, change the query builder from builder to code and use the expressions below.
1.  Title: Node
 - Data source: Loki
 - type: Pie Chart
 - Code: sum by (application) (count_over_time({source=~"(?i)$NE"}[30s]))
 What does it do? For each application, count how many log lines matching source=~$NE appeared in the last 30 seconds, summed across all matching streams.

2.  Title: Node - count per app
 - Data source: Loki
 - type: Time Series
 - Code: sum by (application) (rate({source="$NE"}[30s]))
What does it do? For each application, compute how fast logs are arriving (logs per second) from sources matching $NE, averaged over the last 30 seconds.

3-  Title: Syslog - per node
 - Data source: Loki
 - type: Logs
 - Code: {application=~".+", source="$NE"}
What does it do? It filters log streams using two label conditions: Application filter and Source filter
After you create the visualization panels, go back to the dashboard and change the source and the application to observe the result in the visualization panels.
Increase the time range to ensure you can visualize the logs you have triggered in this activity or trigger new event logs that you can see in the loki panels.
3.6 Generating test events#
How do you test logging for an event that never or rarely happens?
You are integrating a new hardware router model in the network, and the operations team, as part of the acceptance report, demands several tests including integration with existing management platforms. They request integration with syslog and test several alarms, including Hardware failures. The NMS team needs to receive the syslog messages to ensure the platform is able to parse and process each of them. How can you trigger Hardware failures alarms?
Your task here is to trigger a "fan failure" log event.
Have a look in the System Management Guide and investigate how you can achieve this.
Tip: How to the log event details?
Use the SR OS 26.3 Log Events Search Tool or the Log Events Guide to find the log event.
You will find:
- Application name: CHASSIS
- Event ID: 2148
- Event name: tmnxEqPhysChassisFanFailure
You may also use the CLI show log event-parameters to find the log event.
Use the following command to get the application-name/id:
Use the following command to get the "Fan" related event-names:
Output:A:admin@g51-pe3# show log event-parameters "chassis" | match fan ignore-case
2148 tmnxEqPhysChassisFanFailure
tmnxPhysChassisFanIndex
tmnxPhysChassisFanOperStatus
tmnxPhysChassisFanSpeedPercent
2149 tmnxEqPhysChassisFanFailureClear
tmnxPhysChassisFanIndex
tmnxPhysChassisFanOperStatus
tmnxPhysChassisFanSpeedPercent
2412 tmnxEsaHwFanBankNonRedun
2413 tmnxEsaHwFanBankNonRedunClr
tmnxEsaStatsFanRedundancy
2414 tmnxEsaHwFanBankFailRedun
2415 tmnxEsaHwFanBankFailRedunClr
tmnxEsaStatsFanRedundancy
2416 tmnxEsaHwFanStatusDegraded
2417 tmnxEsaHwFanStatusDegradedClr
tmnxEsaStatsFanStatus
2418 tmnxEsaHwFanStatusFailed
2419 tmnxEsaHwFanStatusFailedClr
tmnxEsaStatsFanStatus
2430 tmnxPowerSupplyFanFailed
2431 tmnxPowerSupplyFanFailedClear
2026-04-20T08:37:47.99+00:00
[/]
A:admin@g51-pe3#
Tip: How to generate the test event?
Have a look to the System Management Guide section Generating test events.
SR OS has the tools perform log generate-event command to generate test events.
- Use the new command to generate an event from an application, or all events from an application.
- Event log tests are sent to the logging system, so they appear in the same log ID as real events.
- The test events consists of fixed and variable parameters.
- Hyphens indicating the maximum length of the variable parameter.
- Illustrate the content of an actual log event for NMS or EHS parsing
Solution
Use the tools perform log generate-eventto generate the event.
Command:
Output:The outputs below display the local log and the captures with TCPDump and TShark.
Local log:
A:admin@g51-pe3# show log log-id 99

===============================================================================
Event Log 99 log-name 99
===============================================================================
Description : Default System Log
warning: 1 events dropped from log
Memory Log contents  [size=500   next event=171  (not wrapped)]

170 2026/04/20 08:40:39.376 UTC CRITICAL: CHASSIS #2148 Base subject--.---------.---------.--
"Chassis 1 fan 30 failure"
TCPDump:
bash# sudo ip netns exec clab-srexperts-syslog tcpdump -nnv  port 5514
dropped privs to tcpdump
tcpdump: listening on eth0, link-type EN10MB (Ethernet), snapshot length 262144 bytes
04:40:39.376513 IP (tos 0x88, ttl 64, id 13115, offset 0, flags [none], proto UDP (17), length 184)
    10.128.51.23.514 > 10.128.51.74.5514: SYSLOG, length: 156
        Facility local7 (23), Severity alert (1)
        Msg: Apr 20 08:40:39 g51-pe3 TMNX: 150 Base CHASSIS-CRITICAL-tmnxEqPhysChassisFanFailure-2148 [subject--.---------.---------.--]:  Chassis 1 fan 30 failure^J
^C
1 packet captured
1 packet received by filter
0 packets dropped by kernel
TShark:
bash#    sudo ip netns exec clab-srexperts-syslog tshark -l -i eth0  -f "port 5514"
Running as user "root" and group "root". This could be dangerous.
Capturing on 'eth0'
    1 0.000000000 10.128.51.23 → 10.128.51.74 Syslog 198 LOCAL7.ALERT: Apr 20 08:40:39 g51-pe3 TMNX: 150 Base CHASSIS-CRITICAL-tmnxEqPhysChassisFanFailure-2148 [subject--.---------.---------.--]:  Chassis 1 fan 30 failure\n
^C1 packet captured
bash#
The Fig. 7 below compare a real event with the corresponding test event:
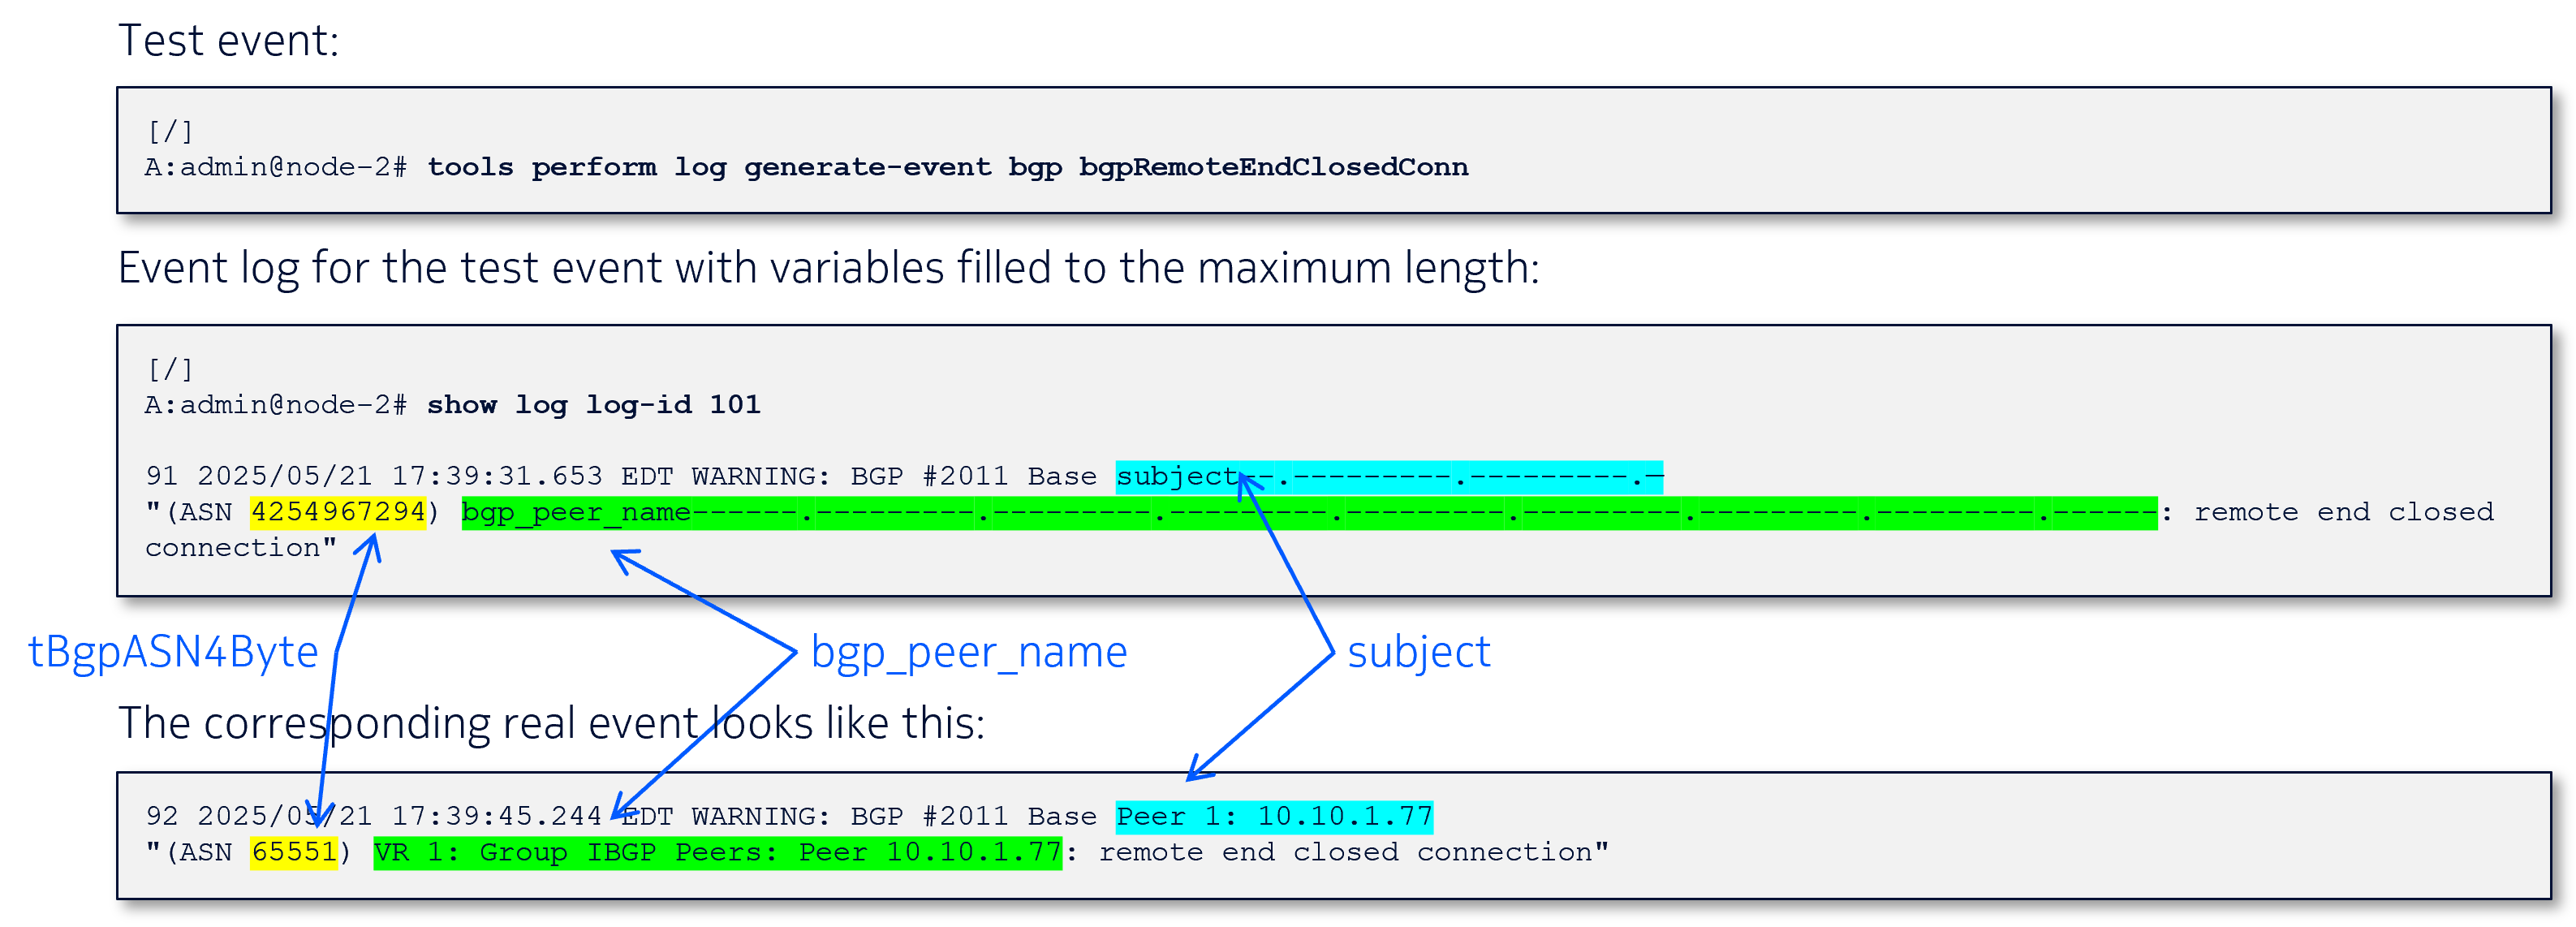
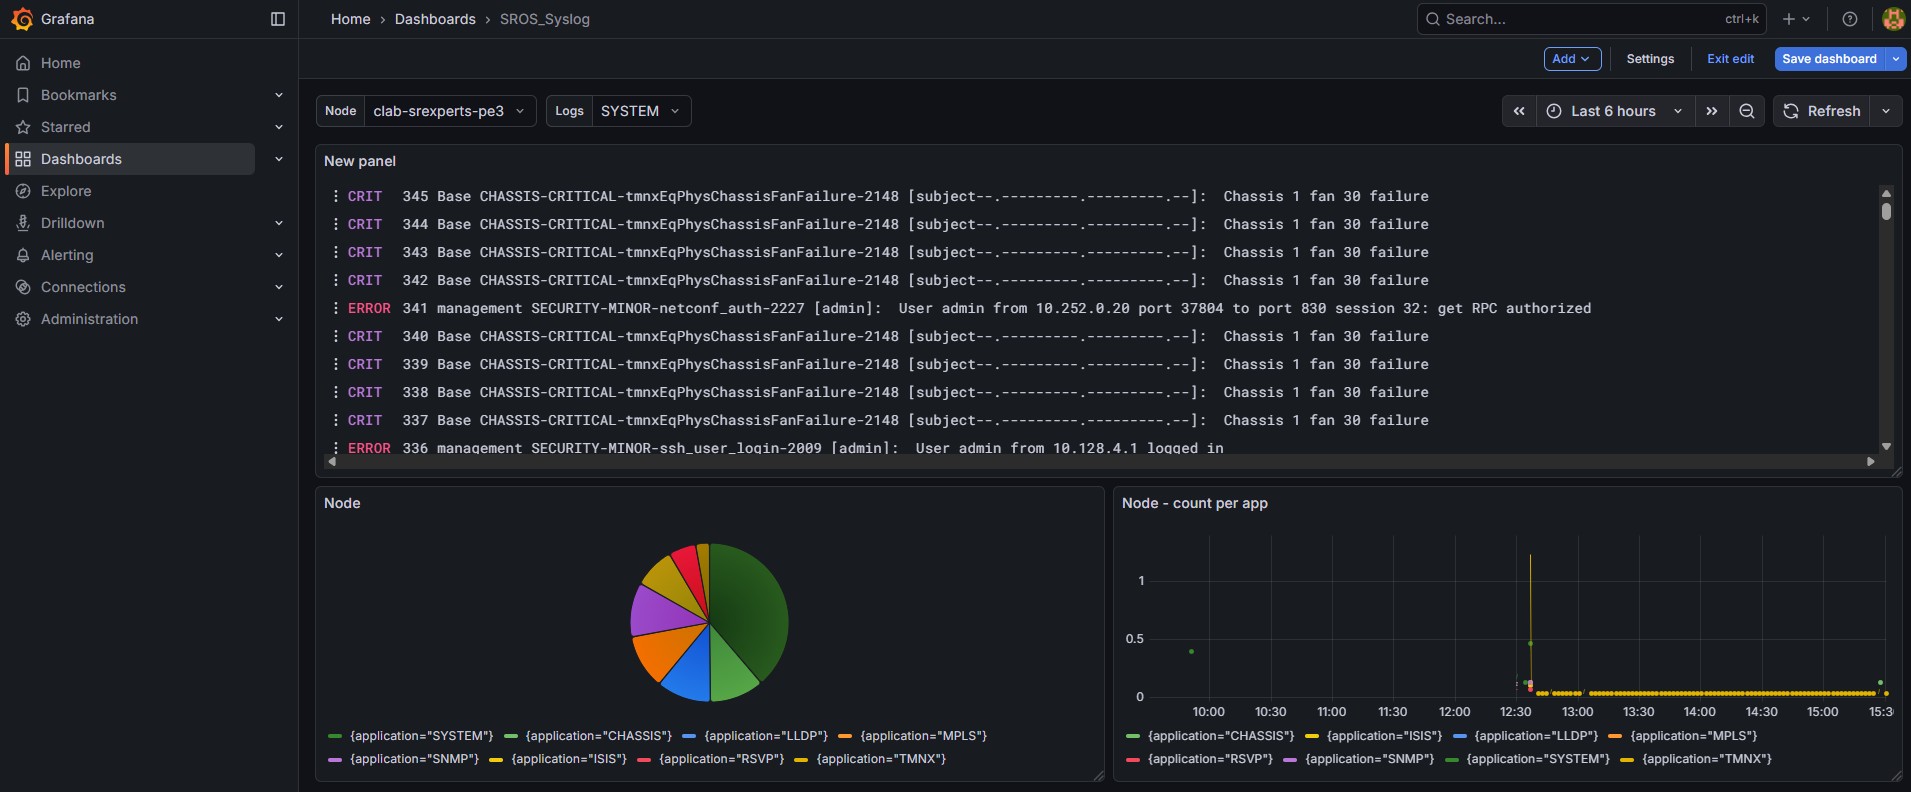
Finally, go back to your Grafana dashboard and observe the logs you just generated.
4. Summary and Review#
Congratulations! If you have got this far you have completed this activity and achieved the following:
- You have configured SR OS to send syslog messages to a remote server
- You have learnt the role of Syslog-ng and Promtail and explored its configurations
- You have used Loki to query logs
- You have created Grafana dashboards consuming logs from Loki
- You have learnt how to generate test events to simulate real log events
This is a pretty extensive list of achievements! Well done!
If you're hungry for more have a go at another activity! Perhaps try a topic that is new to you?
If you're interested in logging activities, then have a look to the SR Linux remote logging with Syslog and Loki activity.