SR OS streaming telemetry#
| Activity name | SR OS streaming telemetry |
| Activity ID | 55 |
| Short Description | SR OS integration in a streaming telemetry stack with gNMIc, Prometheus and Grafana |
| Difficulty | Beginner |
| Tools used | gNMIc Prometheus Grafana Nokia YANG browser |
| Topology Nodes | PE1, PE2 |
| References | SR OS documentation SR OS gRPC server |
You are a Network Engineer working on a project to deploy new SR OS nodes into the existing network. You have already installed, configured and integrated the new nodes, and the next step before it's ready for production is to integrate the nodes into the management systems.
You have been asked to configure and integrate the nodes into the streaming telemetry stack comprising of gNMIc, Prometheus and Grafana.
1. Objective#
The objective is to deploy streaming telemetry from the SR OS nodes through the monitoring stack and understand the benefits of this modern approach to network monitoring.
Before you start you will need to get familiar with streaming telemetry on SR OS by making use of gNMI (gRPC Network Management Interface) to retrieve data from the nodes using a gNMI client tool called gnmic. You will learn the building blocks, the advantages of telemetry and how the monitoring stack works by collecting additional data and visualizing this data in Grafana. In particular you will look at:
- The differences between SNMP and streaming telemetry
- How to identify and subscribe to streaming telemetry metrics
- How the components of the telemetry monitoring stack work together
- How to configure and enable streaming telemetry using gNMI over gRPC on SR OS
- How to create visualizations of the metrics you receive in Grafana
2. Technology explanation#
Today's networks require reliable monitoring in the WAN, Edge, and data center domains, emphasizing real-time data collection and transmission for network visibility. Streaming telemetry is the comprehensive practice of transmitting measurements from various network devices in real time to a collector for storage and further processing, ultimately creating a monitoring and reporting system.
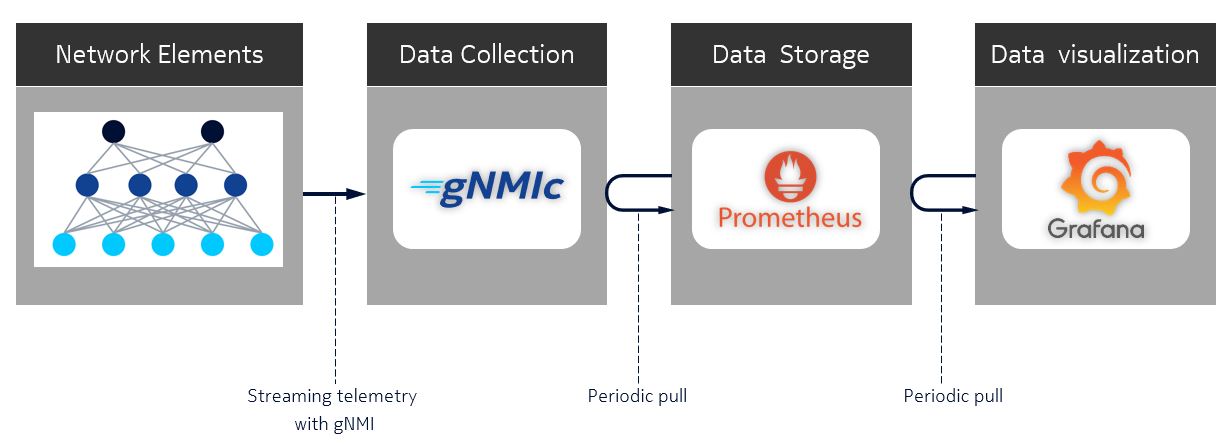
A streaming telemetry monitoring stack typically consists of:
- A telemetry collector (for example, in this activity we will use gNMIc) to retrieve the metrics from the network elements.
- A time-series database (TSDB) (for example, in this activity we will use Prometheus) to collect, store and aggregate the collected metrics.
- A visualization tool (for example, in this activity we will use Grafana) to visualize the collected data and run queries on top of it.
gNMI is a modern gRPC-based network management interface that is currently the most popular protocol to collect streaming telemetry data from networking devices. It is important to understand, that Streaming Telemetry with gNMI operates on the configuration and state data streamed from the network devices, but it does not provide flow extraction/sampling like NetFlow/IPFIX.
2.1 Streaming telemetry vs. SNMP#
The alternative to streaming telemetry data is the widely used SNMP (Simple Network Management Protocol) a pull-based model where the monitoring system periodically requests data from network devices. This method can cause delays in detecting issues and consumes considerable resources on both the monitored device and the monitoring system.
In contrast, streaming telemetry’s push-based approach allows network devices to stream data continuously and automatically to a centralized location. This approach enables near real-time network data collection, significantly improving the visibility and responsiveness of network monitoring.
2.2 What is gNMI#
gRPC Network Management Interface (gNMI) is a protocol to manage and report a network element’s configuration and operational data. gNMI is built on top of Google’s widely deployed gRPC protocol. gRPC provides protocol buffers (protobufs), a language neutral mechanism to transport structured data efficiently over networks making it an ideal method for streaming operational data from network elements.
There are 4 remote procedure calls (RPC) services defined by the gNMI specification which are supported by SR OS:
- Capabilities - Provides the client with information about the device, such as gNMI version, used data models and supported encodings. Frequently used to test the gNMI connection.
- Get - Retrieve information from the device, typically small amount of data.
- Set - Is used to set, modify or delete configuration on a network device.
- Subscribe - Used for streaming telemetry - receiving a stream of state or configuration data from the device. The
subscribeRPC supports different modes: In asamplemode, the data is returned with a cadence governed by a client-provided interval; in anon_changemode data is streamed every time there is a change in the subscribed data elements.
2.3 gNMIc as a command line interface to gNMI#
gNMIc is a command line tool developed by Nokia and donated to the OpenConfig project. It lets you interact with the gNMI server running on the SR OS nodes. It can be used to run the various RPCs we discussed above against SR OS. It has been pre-installed on your hackathon instance although you may install it locally if you'd prefer (follow the installation instructions if you would like to do this (it is not necessary to complete this activity)).
Log into your lab server and run gnmic command with the --help parameter. Take a look at the available commands this tool offers. You should recognize the 4 gNMI RPCs: Capabilities, Get, Set, and Subscribe.
Note, that the
gnmicCLI tool is already installed on your hackathon instance.
Output: gnmic --help
$ gnmic --help
run gnmi rpcs from the terminal (https://gnmic.openconfig.net)

Usage:
  gnmic [command]

Available Commands:
  capabilities query targets gnmi capabilities
  get          run gnmi get on targets
  help         Help about any command
  ...          ...
  set          run gnmi set on targets
  subscribe    subscribe to gnmi updates on targets
  version      show gnmic version
2.4 Identify the gNMI path to subscribe to#
The next step is fetching or subscribing to data from SR OS. Since SR OS is a fully YANG-modelled NOS, we need to identify the gNMI paths that point to the data we want to fetch. You can find these paths in the SR OS CLI.
Open a second terminal where you log into pe1.
Let's say you want the gNMI path to retrieve the system name of this device. The MD-CLI configuration context is:
You can find the gNMI path by running the the pwc gnmi-path in the configuration context. The name is a leaf, you must navigate to the /configure system context:
Output: pwc gnmi-path
From the output you can see that to retrieve the system name you will need to use the following gNMI path: /configure/system. If you want only the name you need to include it at the end of the gnmi-path: /configure/system/name.
CLI users who are well familiar with the SR OS YANG model may use this approach, but in many cases, you may not know where or what you are looking for. In this situation the Nokia YANG browser may be a good option to try.
The YANG browser lets you do a search through the SR OS YANG model. By simply typing for certain keywords (for example "system name"), the YANG browser will return any matches found.
3. Tasks#
You should read these tasks from top-to-bottom before beginning the activity.
It is tempting to skip ahead but tasks may require you to have completed previous tasks before tackling them.
3.1 gNMI get#
You are trying to integrate your SR OS nodes into the telemetry monitoring stack, however, before you start with the telemetry stack you need to learn how to stream metrics from SR OS nodes.
Start by testing gNMIc connectivity. Use gnmic capabilities operation to fetch the capabilities or the get operation to fetch the system name of PE1 using the gNMI path you identified earlier.
Tip: How to test gnmic
Use gnmic --help to get all the options or refer to the gNMIc web page for instructions.
You will need to execute gNMIc with:
- hostname: clab-srexperts-pe1
- user: admin
- password: $EVENT_PASSWORD
- insecure: --insecure
- [optional] encoding: ascii or json_ietf (ascii for Human-readable or json_ietf for automation)
- request:
capabilitiesorgetthesystem namepath
You will need to collect the network interface counters to have visibility over the MPLS traffic-rate in your network. Find the gNMI path for interface pe2 traffic-rate and run gnmic with the get operation again. You will notice that there are in-octets and out-octets interface counters that you can use to match in the YANG browser.
Tip: How to get the gNMI path?
Use the YANG Browser and search by in-octets or out-octets.
Alternatively, you may use the following CLI command to find the gNMI path from within state context (navigate to the state context and use the pwc gnmi-path):
Example CLI output:
Question: If you need these statistics for all existing interfaces, is there an easy way to collect them all?
Yes, you just need to update your gnmi-path and replace pe2 with *. This will match all configured interfaces.
If you are stuck, click here for a solution
The command to retrieve the capabilities is:
$ gnmic -a clab-srexperts-pe1 -u admin -p $EVENT_PASSWORD --insecure capabilities
gNMI version: 0.8.0
supported models:
  - nokia-conf, Nokia, 26.3.R1
  - nokia-state, Nokia, 26.3.R1
  - nokia-bof-conf, Nokia, 26.3.R1
  - nokia-bof-state, Nokia, 26.3.R1
  - nokia-debug-conf, Nokia, 26.3.R1
  - nokia-debug-state, Nokia, 26.3.R1
  - nokia-li-conf, Nokia, 26.3.R1
  - nokia-li-state, Nokia, 26.3.R1
supported encodings:
  - JSON
  - BYTES
  - PROTO
  - JSON_IETF
The command to retrieve the system name is:
gnmic -a clab-srexperts-pe1 -u admin -p $EVENT_PASSWORD  --insecure get \
    --path /configure/system/name
$  gnmic -a clab-srexperts-pe1 -u admin -p $EVENT_PASSWORD  --insecure get \
    --path /configure/system/name
[
  {
    "source": "clab-srexperts-pe1",
    "timestamp": 1778526070548487818,
    "time": "2026-05-11T15:01:10.548487818-04:00",
    "updates": [
      {
        "Path": "configure/system/name",
        "values": {
          "configure/system/name": "g51-pe1"
        }
      }
    ]
  }
]
The command to retrieve the interface counters is:
gnmic -a clab-srexperts-pe1 -u admin -p $EVENT_PASSWORD --insecure get \
    --path '/state/router[router-name=Base]/interface[interface-name=pe2]/statistics/mpls'
$ gnmic -a clab-srexperts-pe1 -u admin -p $EVENT_PASSWORD --insecure get \
    --path '/state/router[router-name=Base]/interface[interface-name=pe2]/statistics/mpls'
[
  {
    "source": "clab-srexperts-pe1",
    "timestamp": 1778526164088930938,
    "time": "2026-05-11T15:02:44.088930938-04:00",
    "updates": [
      {
        "Path": "state/router[router-name=Base]/interface[interface-name=pe2]/statistics/mpls",
        "values": {
          "state/router/interface/statistics/mpls": {
            "in-octets": "842",
            "in-packets": "10",
            "out-octets": "788",
            "out-packets": "10"
          }
        }
      }
    ]
  }
]
The command to retrieve the interface counters for all interfaces is:
gnmic -a clab-srexperts-pe1 -u admin -p $EVENT_PASSWORD --insecure get \
    --path '/state/router[router-name=Base]/interface[interface-name=*]/statistics/mpls'
$ $gnmic -a clab-srexperts-pe1 -u admin -p $EVENT_PASSWORD --insecure get \
    --path '/state/router[router-name=Base]/interface[interface-name=*]/statistics/mpls'
[
  {
    "source": "clab-srexperts-pe1",
    "timestamp": 1778526291351529677,
    "time": "2026-05-11T15:04:51.351529677-04:00",
    "updates": [
      {
        "Path": "state/router[router-name=Base]/interface[interface-name=system]/statistics/mpls",
        "values": {
          "state/router/interface/statistics/mpls": {
            "in-octets": "0",
            "in-packets": "0",
            "out-octets": "0",
            "out-packets": "0"
          }
        }
      },
<snippet>
3.2 gNMI subscriptions#
To collect telemetry data and create visualization dashboards you need continuously streaming data. This is done using the gNMI subscribe RPC.
Instead of performing a gNMI get, use the subscribe RPC to stream the pe2 interface every 5 seconds.
Use the gnmic command with the subscribe parameter. You will also need to set the stream-mode to sample and the sample-interval to 5 seconds. The interface counters should now be displayed on your terminal every 5 seconds.
Solution: gnmic subscribe as a sample with a specific sample-interval
The command to subscribe is:
$ gnmic -a clab-srexperts-pe1 -u admin -p $EVENT_PASSWORD --insecure subscribe \
    --stream-mode sample --sample-interval 5s \
    --path '/state/router[router-name=Base]/interface[interface-name=pe2]/statistics/mpls'
{
  "source": "clab-srexperts-pe1",
  "subscription-name": "default-1778527537",
  "timestamp": 1778527542350438709,
  "time": "2026-05-11T15:25:42.350438709-04:00",
  "prefix": "state/router[router-name=Base]/interface[interface-name=pe2]/statistics/mpls",
  "updates": [
    {
      "Path": "out-packets",
      "values": {
        "out-packets": "10"
      }
    },
    {
      "Path": "out-octets",
      "values": {
        "out-octets": "788"
      }
    },
    {
      "Path": "in-packets",
      "values": {
        "in-packets": "10"
      }
    },
    {
      "Path": "in-octets",
      "values": {
        "in-octets": "842"
      }
    }
  ]
}
{
  "sync-response": true
}
<update every 5 seconds>
}
Choosing a stream mode of sample is useful when you have fast changing data, but there are other cases where your operational data doesn't change frequently. Think about BGP neighborship states or interface operational states. It wouldn't be useful to receive their status every 5 seconds if it almost never changes. It would be much more efficient if we only receive an update when their state changes. For these cases you can use the on-change stream mode.
Search the YANG browser for the gNMI path corresponding to the oper-state of the physical ports.
Adjust the stream mode to on-change and try to fetch the oper-state of the port 1/1/c8/1 ( PE2's interface). Then disable and re-enable the interface in the configuration (don't forget to commit your changes). You should notice that we only will receive an update when the operational state of the port 1/1/c8/1 changes.
Solution: gnmic subscribe using the on-change stream mode
The command to subscribe is:
$ gnmic -a clab-srexperts-pe1 -u admin -p $EVENT_PASSWORD --insecure subscribe \
    --stream-mode on-change \
    --path '/state/port[port-id=1/1/c8/1]/oper-state'
{
  "source": "clab-srexperts-pe1",
  "subscription-name": "default-1778527914",
  "timestamp": 1778527914579094729,
  "time": "2026-05-11T15:31:54.579094729-04:00",
  "prefix": "state/port[port-id=1/1/c8/1]",
  "updates": [
    {
      "Path": "oper-state",
      "values": {
        "oper-state": "up"
      }
    }
  ]
}
{
  "sync-response": true
}
{
  "source": "clab-srexperts-pe1",
  "subscription-name": "default-1778527914",
  "timestamp": 1778527966186975580,
  "time": "2026-05-11T15:32:46.18697558-04:00",
  "prefix": "state/port[port-id=1/1/c8/1]",
  "updates": [
    {
      "Path": "oper-state",
      "values": {
        "oper-state": "down"
      }
    }
  ]
}
{
  "source": "clab-srexperts-pe1",
  "subscription-name": "default-1778527914",
  "timestamp": 1778527973207043674,
  "time": "2026-05-11T15:32:53.207043674-04:00",
  "prefix": "state/port[port-id=1/1/c8/1]",
  "updates": [
    {
      "Path": "oper-state",
      "values": {
        "oper-state": "up"
      }
    }
  ]
}
3.3 Streaming telemetry using the telemetry monitoring stack#
Now that you know how to stream metrics from SR OS nodes, it's time to take it to the next level. Visualizing the data using a telemetry monitoring stack is crucial for understanding what is happening in your network in real-time. A telemetry monitoring stack typically consists of three elements:
- A telemetry collector (We will use gNMIc)
- A time series database (TSDB) (We will use Prometheus)
- A visualization dashboard (We will use Grafana)
Let's have a closer look at the telemetry stack components and try to understand what their roles are.
3.3.1 gNMIc#
gNMIc is used to subscribe to the telemetry data from the network nodes and expose it to the Prometheus time-series database.
The gNMIc configuration file config.yml(file at ~/SReXperts/clab/configs/gnmic/config.yml) is applied to the gNMIc container at startup. It instructs the container to subscribe to telemetry data and export it to the Prometheus time-series database. Examine the file to locate where the gNMI paths are described. You should also note Prometheus is defined as an output.
Output: gNMIc config-yml
Configuration file available at ~/SReXperts/clab/configs/gnmic/config.yml.
username: admin
password: ${GNMIC_PASSWORD}
port: 57400
timeout: 10s

loader:
  type: docker

  address: unix:///run/docker.sock
  filters:

    - containers:
        # containers returned by `docker ps -f "label=clab-node-kind=nokia_srsim"`
        - label: clab-node-kind=nokia_srsim
      network:
        # networks returned by `docker network ls -f "name=srexperts"`
        name: srexperts

      # the value of label=gnmi-port exported by each container`
      port: "57400"
      config:
        username: admin
        insecure: true
        encoding: json
        subscriptions:
          - sros_ports_stats
          - sros_router_bgp
          - sros_router_interface
          - sros_router_isis
          - sros_router_route_table
          - sros_system
          - sros_service_stats
          - sros_twamp

#<snippet>

  sros_ports_stats:
    paths:
      - /state/port/oper-state
      - /state/port/statistics/
      - /state/port/ethernet/statistics/
    stream-mode: sample
    sample-interval: 5s

  sros_router_bgp:
    paths:
      - /state/router/bgp/statistics/
      - /state/router/bgp/statistics/routes-per-family/
      - /state/router/bgp/neighbor/statistics/
    stream-mode: sample
    sample-interval: 5s

  sros_router_interface:
    paths:
      - /state/router/interface/ipv4/statistics/
      - /state/router/interface/ipv6/statistics/
      - /state/router/interface/statistics/
    stream-mode: sample
    sample-interval: 5s

#<snippet>

outputs:
  prom:
    type: prometheus
    listen: :9273
    path: /metrics
    export-timestamps: true
    strings-as-labels: true
    debug: false
    event-processors:
      - trim-sros-prefixes
      - add-labels
      - trim-regex
      - group-by-interface
      - up-down-map
#<snippet>
3.3.2 Prometheus#
Prometheus is a popular open-source time-series database (TSDB). It is used in this lab to scrape and store the telemetry data exposed by the telemetry collector (gNMIc) every 5 seconds. Metrics are stored with the timestamp (Time Series Data) at which they were recorded, alongside optional key-value pairs called labels.
Output: Prometheus configuration file prometheus.yml
If you need to adjust the data that is scraped by Prometheus you have to edit the prometheus.yml file (file at ~/SReXperts/clab/configs/prometheus/prometheus.yml).
Open Prometheus and write port in the search bar and note the options shown by the auto completion.
To open up Prometheus UI on your laptop use
http://<group-id>.srexperts.net:9090address.
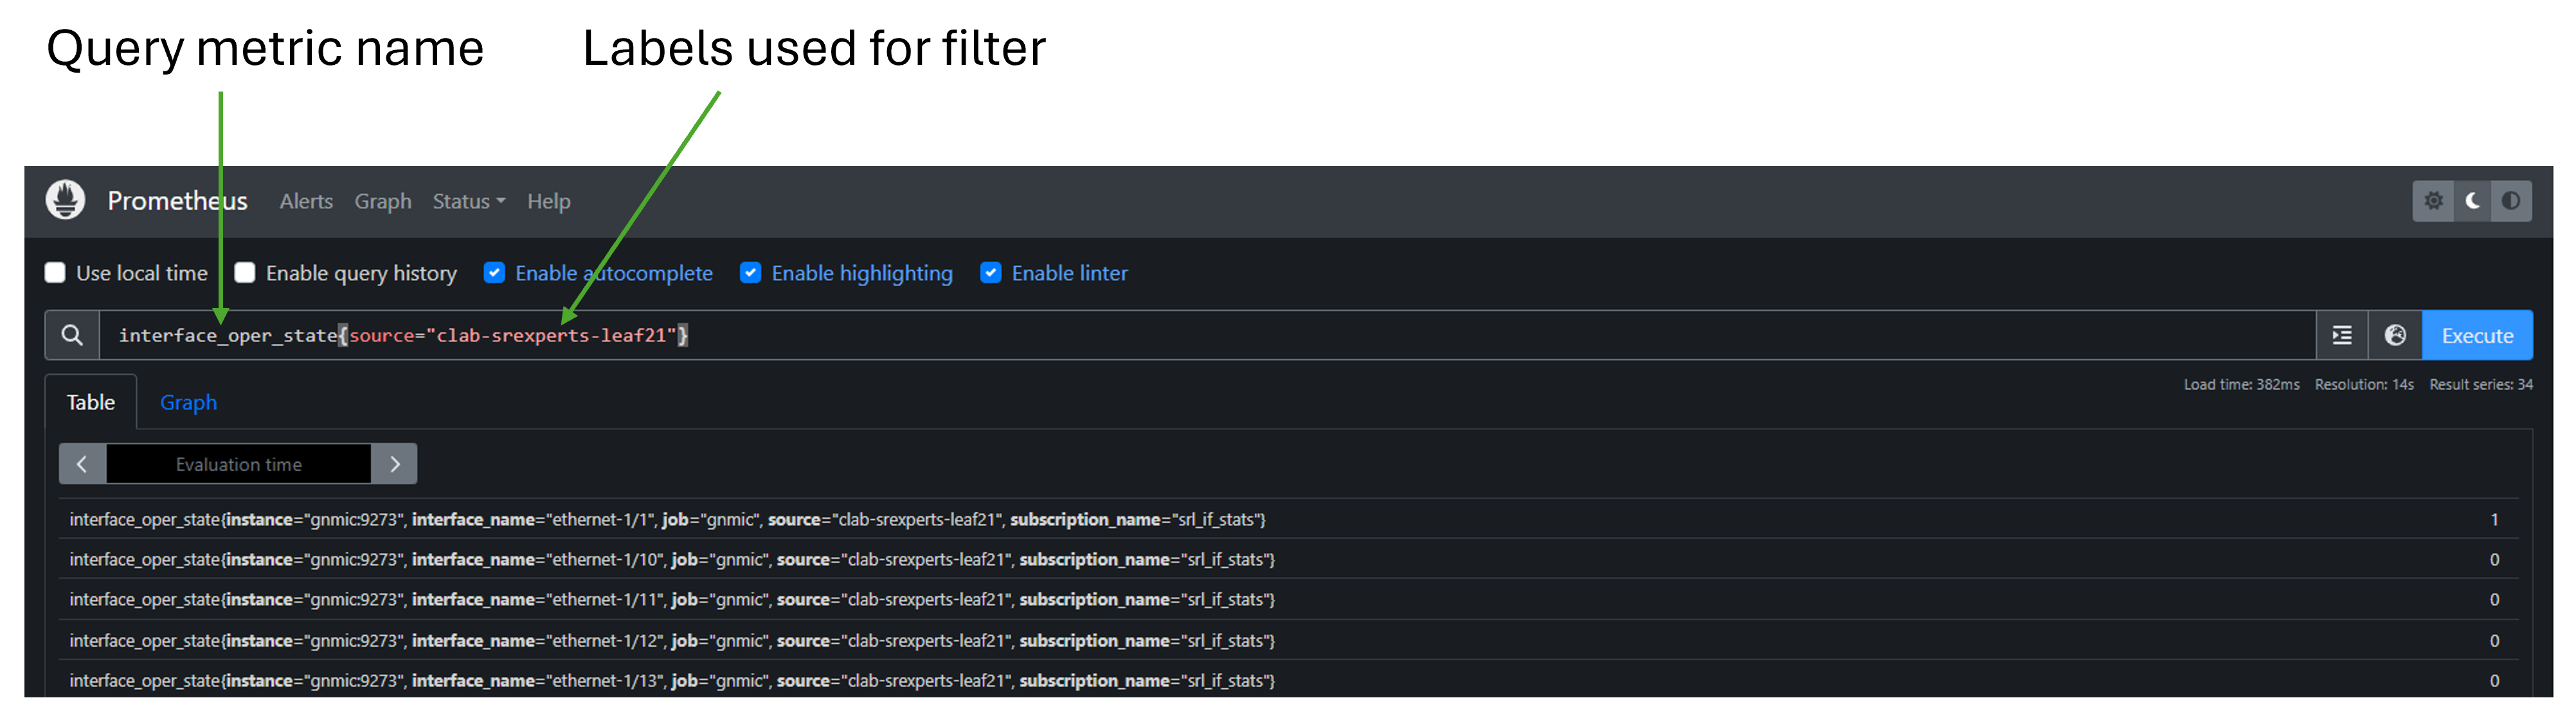
Execute a few queries and observe the result, for example: port_oper_state or port_oper_state{port_port_id="1/1/c8"}.
3.3.3 Grafana#
Grafana is another key component of the telemetry monitoring stack, as it provides visualization for the collected telemetry data. There are preconfigured reference dashboards that provide multiple views on the collected real-time data.
To open up the Grafana UI on your laptop, use your browser to go to the
http://<group-id>.srexperts.net:3000address.
Grafana is pre-configured with anonymous access enabled so that you can view the dashboards without authentication. To edit the dashboards you have to login with the username admin and password $EVENT_PASSWORD. The login button is in the top right corner of the Grafana UI. There are some preconfigured dashboards available.
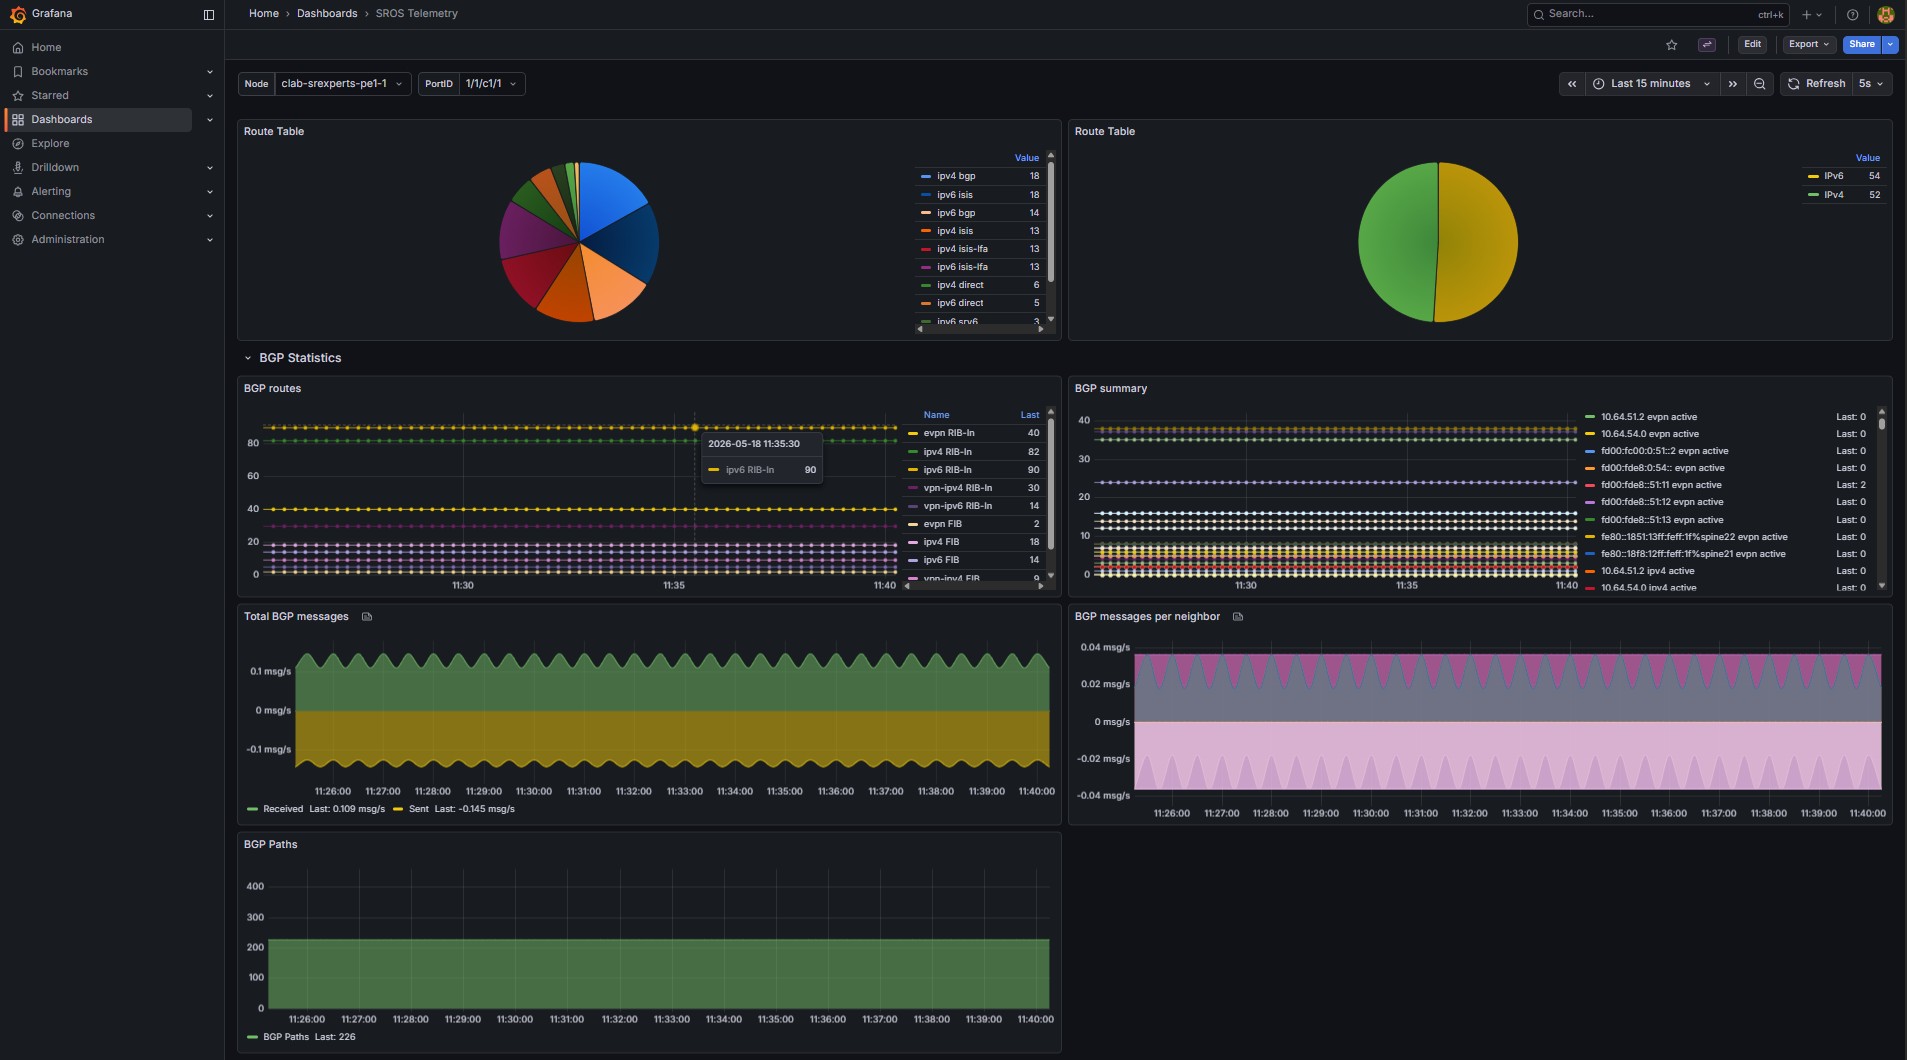
Navigate to the SR OS Telemetry dashboard to explore the look and feel of what is available. Check which panels are available and what data they show. Try to understand how the data is collected and how it is visualized.
3.4 Create new dashboards#
To create dashboards you will need to log in. Click on the Sign in button in the top right. User admin with password $EVENT_PASSWORD.
If you look to the SR OS Telemetry dashboard you will see distinct panels with distinct visualization formats (Pie chart, Time Series, bar chart,...). You will find panels showing hardware related information (CPU, memory, port status), IP and MPLS traffic, port statistics, route table or BGP statistics as shown below.
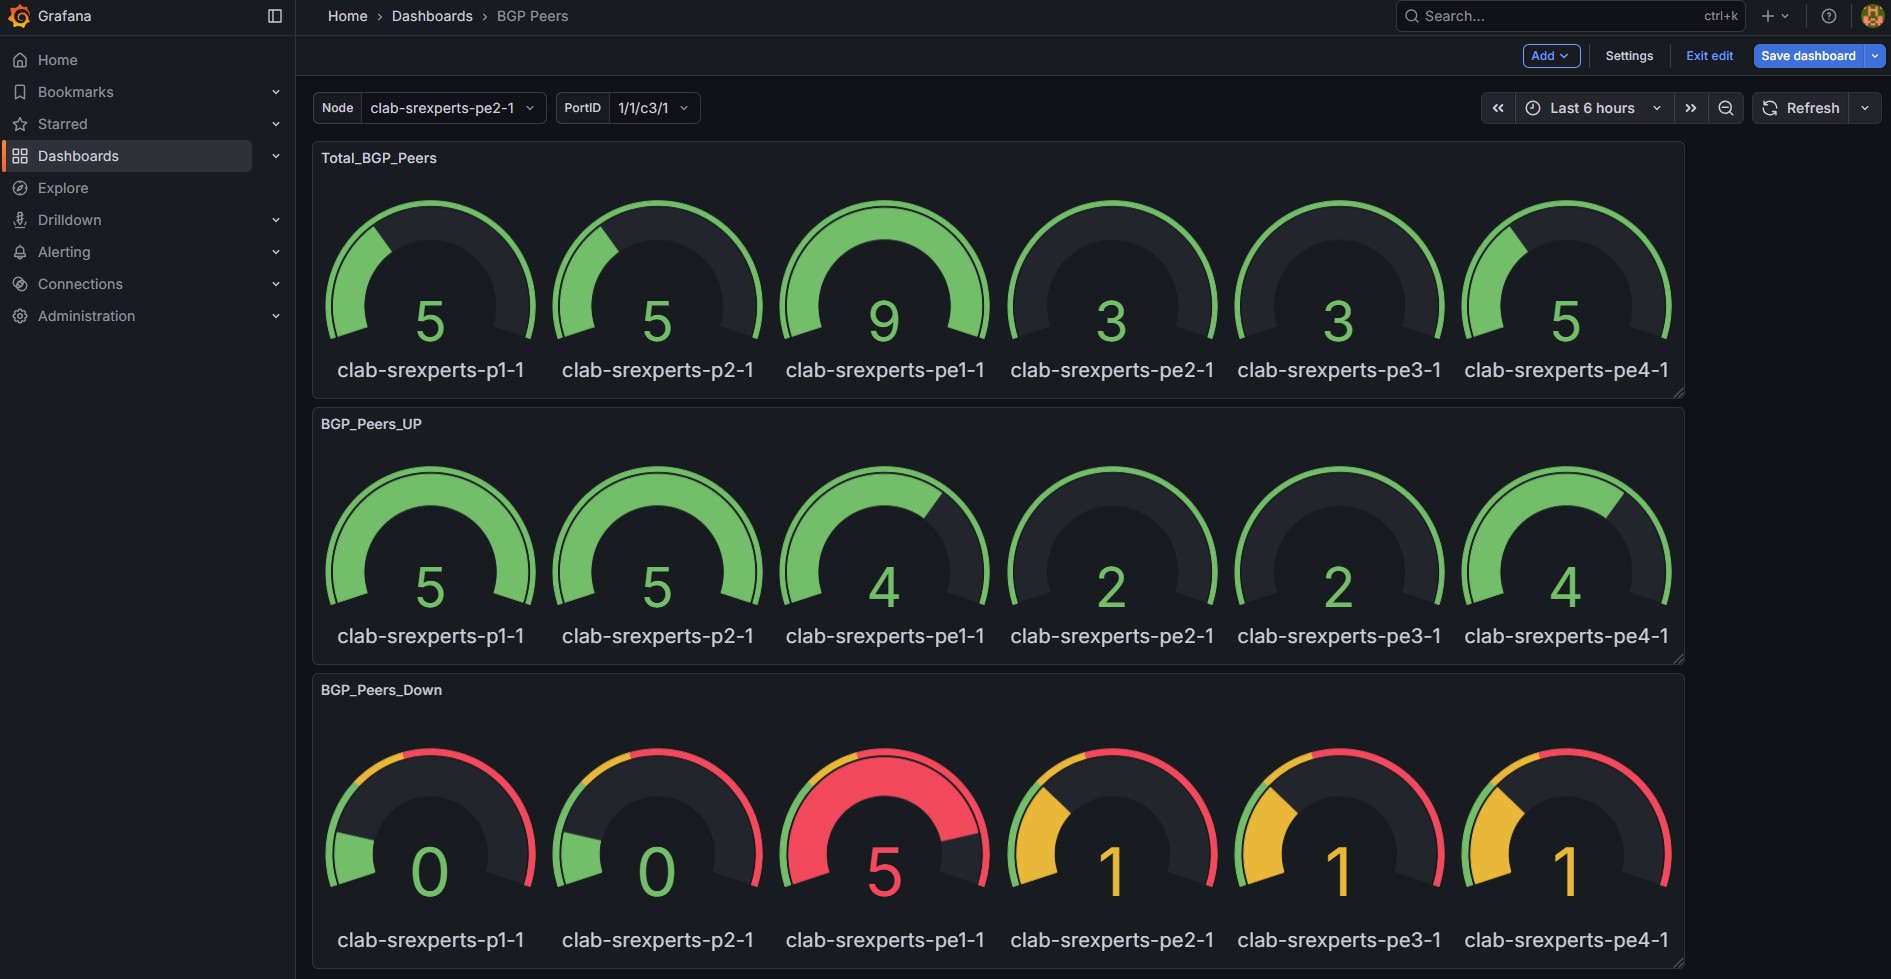
Your task is to create a dashboard for the SR OS nodes with 3 panels displaying the BGP peer information per node:
- BGP Total Peers per node
- BGP Peers UP (established sessions)
- BGP Peers Down
To calculate the "BGP Total Peers per node" you may use the router_bgp_statistics_peers metric.
To calculate the "BGP Peers UP" you may use the router_bgp_neighbor_statistics_session_state metric where session_state="Established".
Ideally you would have a gnmic on-change subscription with a transform logic that would allow you to calculate this directly. In this setup you should use the available gnmic sample metrics and create a PromQL query to achieve this.
You can calculate the amount of "BGP Peers Down" by subtracting the number of "BGP Peers UP" to the number of "BGP Total Peers".
Tip: How to build your Grafana queries
Grafana and Prometheus use the exact same Prometheus Query Language (PromQL) syntax. Grafana acts as a visualization layer that queries a Prometheus data source, allowing you to use standard PromQL expressions. When building you dashboard panels you have the option to use the query Builder (visual support to build the query) or Code option (use the PromQL query directly).
-
BGP Total Peers per node
Calculate the "BGP Total Peers" per node is straightforward, you may use the
router_bgp_statistics_peersmetric, but you should also aggregate the entries per source node to align with the other formulas to calculate the BGP Peers Up and Down. Use the template replacing the metric: -
BGP Peers UP (established sessions)
Calculate the "BGP Peers UP" is a bit more complex because you have distinct entries per peer per node. You must combine multiple items in the same query:
- You need to use the
router_bgp_neighbor_statistics_session_statemetric wheresession_state="Established" - Optimize the query to search the last value in the last 5 seconds (sample interval) using the
last_over_timefunction - Aggregate the previous results by source
- If a node has no peers, you'll not match the previous metric, but you still want to display it with 0 Peers. Use an
Oroperation as shown in the template below
Use the template replacing the required elements:
- You need to use the
-
BGP Peers Down
You just need to subtract the "BGP Total Peers" with the "BGP Peers UP" using both PromQL queries you build before. Use the template replacing the required elements:
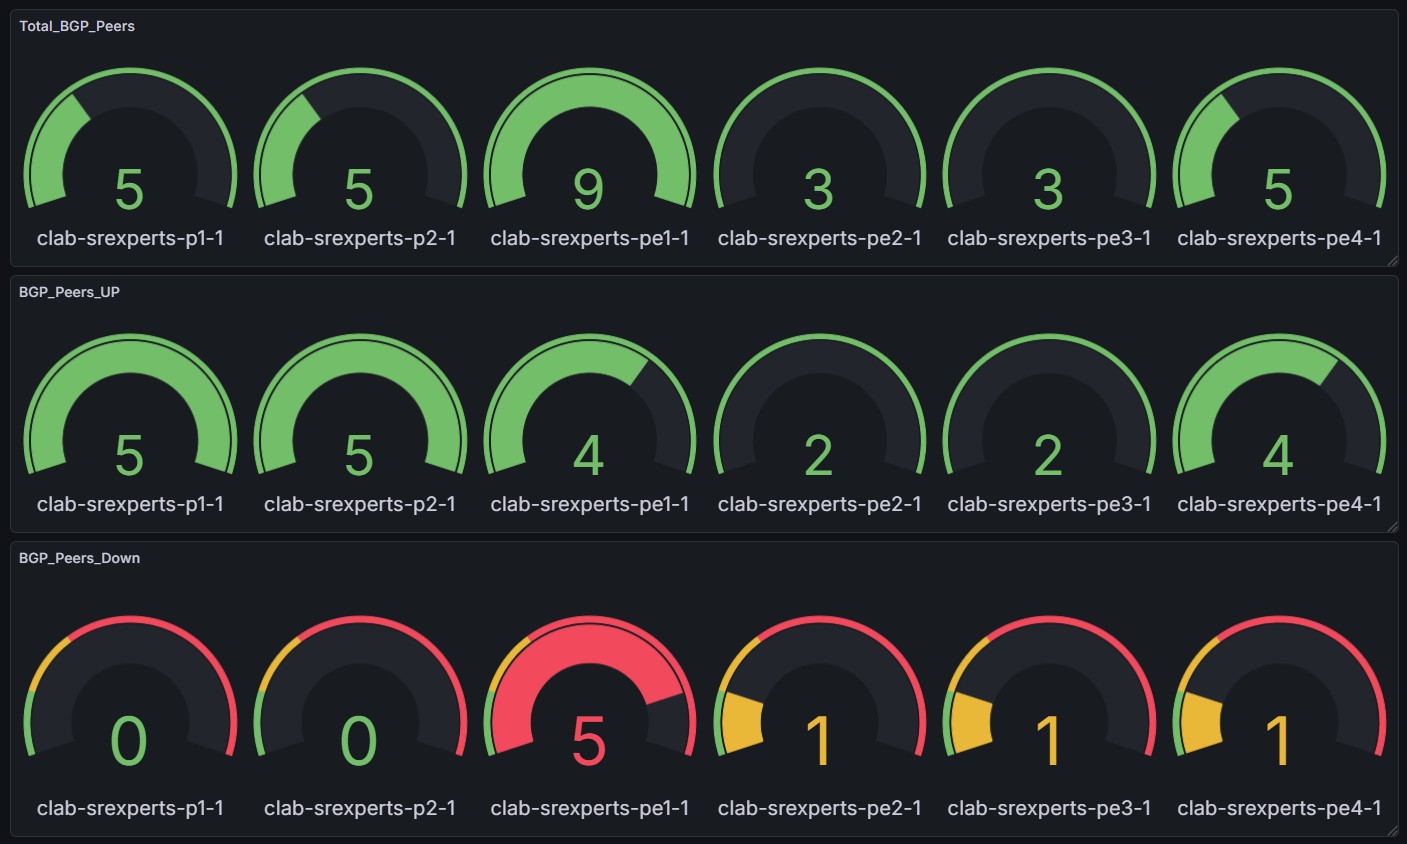
An example of what your dashboard panels showing the BGP peer information per node might look like is shown below.
You may change the dashboard refresh interval to 5 seconds to ensure that the changes are reflected faster in your dashboards.
Tip: Test you dashboard
You may test your dashboards by enabling or disabling BGP neighbors for a node and observe the changes in your dashboards.
You may use the CLI or the gnmic calls below to disable and re-enable BGP neighbors.
You should expect a few seconds delay after a commit or the gnmic call execution for the changes to become visible in the dashboards.
From your Hackathon instance disable two BGP neighbors with the gnmic call below and then observe the change in your dashboard.
gnmic -a clab-srexperts-pe1 -u admin -p $EVENT_PASSWORD --insecure set \
    --update-path '/configure/router[router-name=Base]/bgp/neighbor[ip-address=10.64.51.2]/admin-state' \
    --update-value disable \
    --update-path '/configure/router[router-name=Base]/bgp/neighbor[ip-address=fd00:fc00:0:51::2]/admin-state' \
    --update-value disable
From your Hackathon instance re-enable the two BGP neighbors with the gnmic call below and then observe the change in your dashboard.
gnmic -a clab-srexperts-pe1 -u admin -p $EVENT_PASSWORD --insecure set \
    --update-path '/configure/router[router-name=Base]/bgp/neighbor[ip-address=10.64.51.2]/admin-state' \
    --update-value enable \
    --update-path '/configure/router[router-name=Base]/bgp/neighbor[ip-address=fd00:fc00:0:51::2]/admin-state' \
    --update-value enable
You may also use the following gnmic subscribe call in parallel to view the changes while you enable and disable the BGP neighbors. Open one session for your Hackathon instance and start a gnmic subscribe to view the changes.
You may filter the output by "session-state" to have a consolidated view as shown below.
gnmic -a clab-srexperts-pe1 -u admin -p $EVENT_PASSWORD --insecure subscribe \
    --stream-mode on-change \
--path '/state/router[router-name=Base]/bgp/neighbor[ip-address=*]/statistics/session-state' | grep -e "session-state"
"Path": "session-state",
"session-state": "Established"
"Path": "session-state",
"session-state": "Established"
"Path": "session-state",
"session-state": "Established"
"Path": "session-state",
"session-state": "Established"
"Path": "session-state",
"session-state": "Established"
"Path": "session-state",
"session-state": "Established"
"Path": "session-state",
"session-state": "Established"
"Path": "session-state",
"session-state": "Established"
"Path": "session-state",
"session-state": "Established"
"Path": "session-state",
"session-state": "Idle"
"Path": "session-state",
"session-state": "Idle"
"Path": "session-state",
"session-state": "OpenSent"
"Path": "session-state",
"session-state": "OpenSent"
"Path": "session-state",
"session-state": "OpenConfirm"
"Path": "session-state",
"session-state": "OpenConfirm"
"Path": "session-state",
"session-state": "Established"
"Path": "session-state",
"session-state": "Established"
Solution: Create BGP peers down dashboard
You first need to create a new dashboard (Click Dashboards -> New -> New Dashboard) and then add the 3 visualization panels.
In the upper right set the Refresh option to 5s.
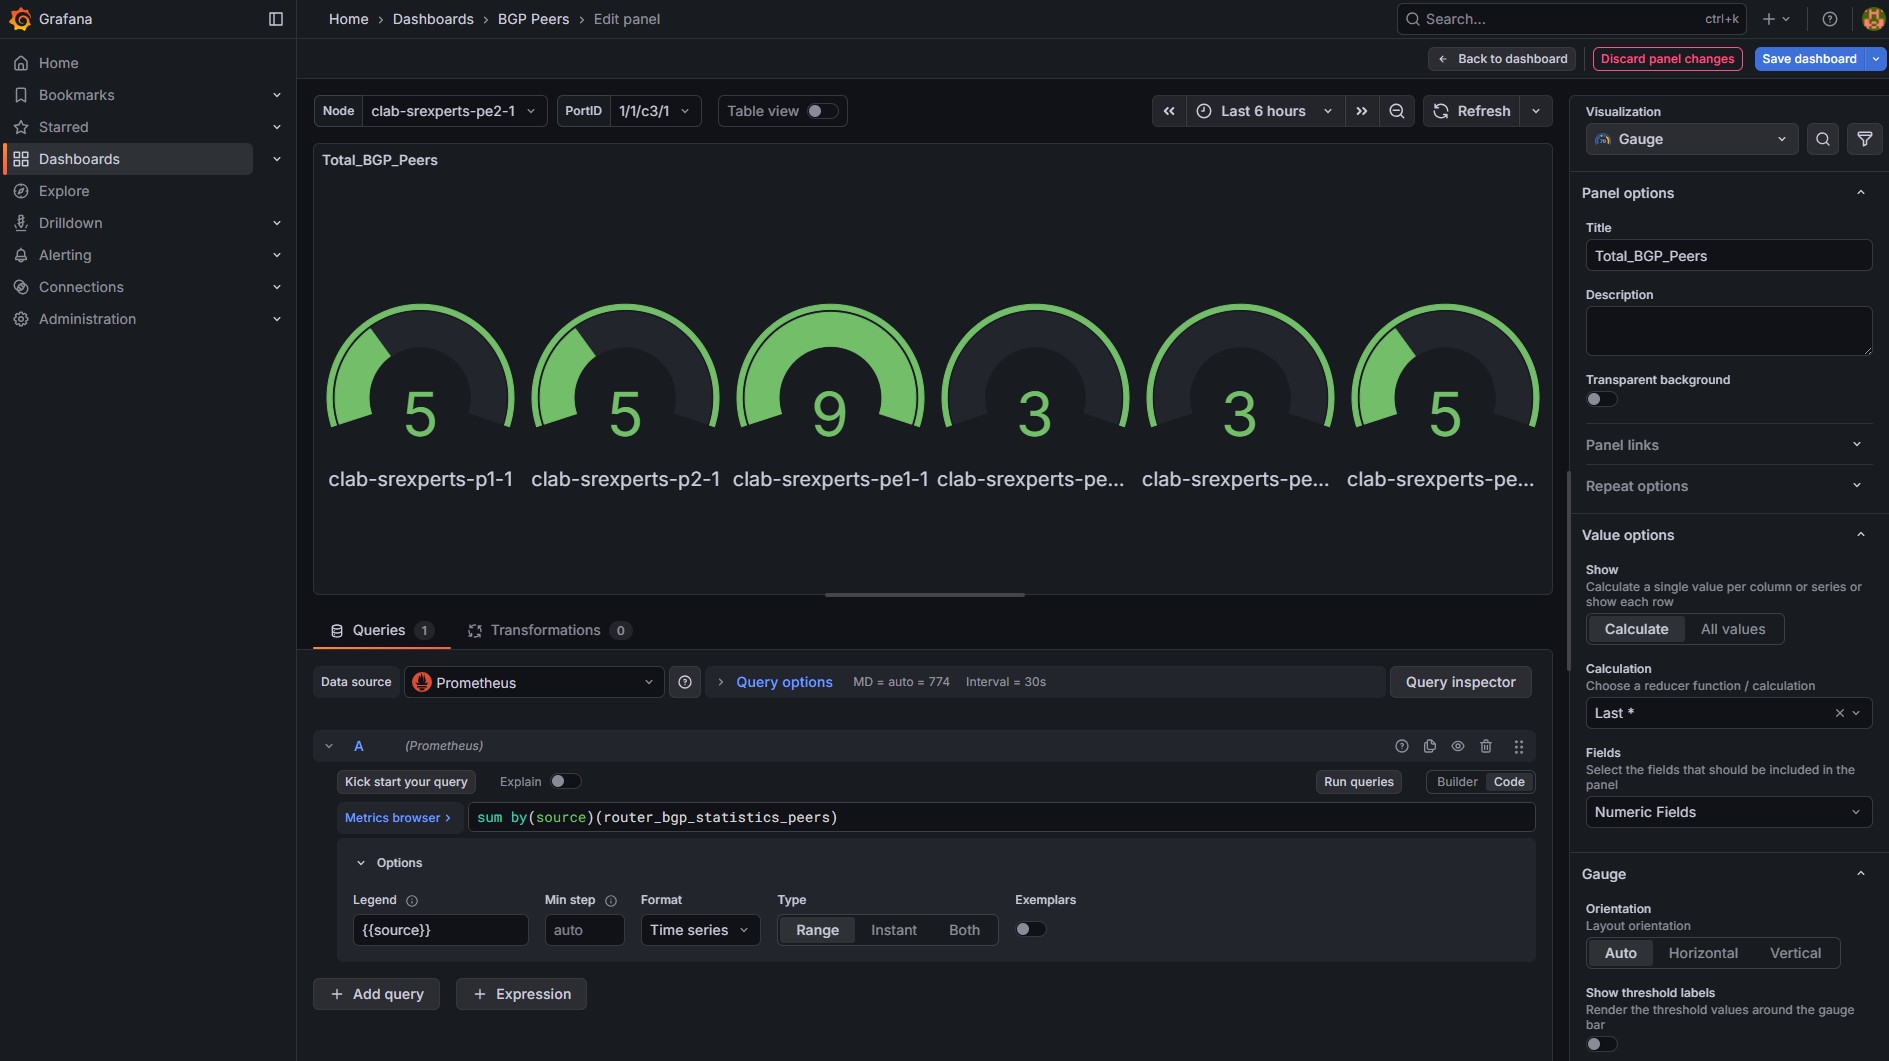
To calculate the total BGP peers per node you must sum the metric router_bgp_statistics_peers per source.
- Click
+ Add visualizationand selectPrometheus - At the bottom you should see the query builder menu.
- Change the Metric view from
BuildertoCode(on the right, next toRun queriesbutton) - In the Metric browser enter the following PromQL query:
sum by(source)(router_bgp_statistics_peers)- Note: you may switch to
Builderto observe the logical actions
- Click
> Optionsand chooseCustomfrom theLegenddropdown menu - Type
{{source}}in theLegendbox - In the upper right, click
Time seriesto expand the dropdown menu - Choose
Gaugefrom the dropdown - Set the title to
Total_BGP_Peers - Select
Back to dashboard
Your panel should now look like this with gauges showing only the total BGP peers per node.
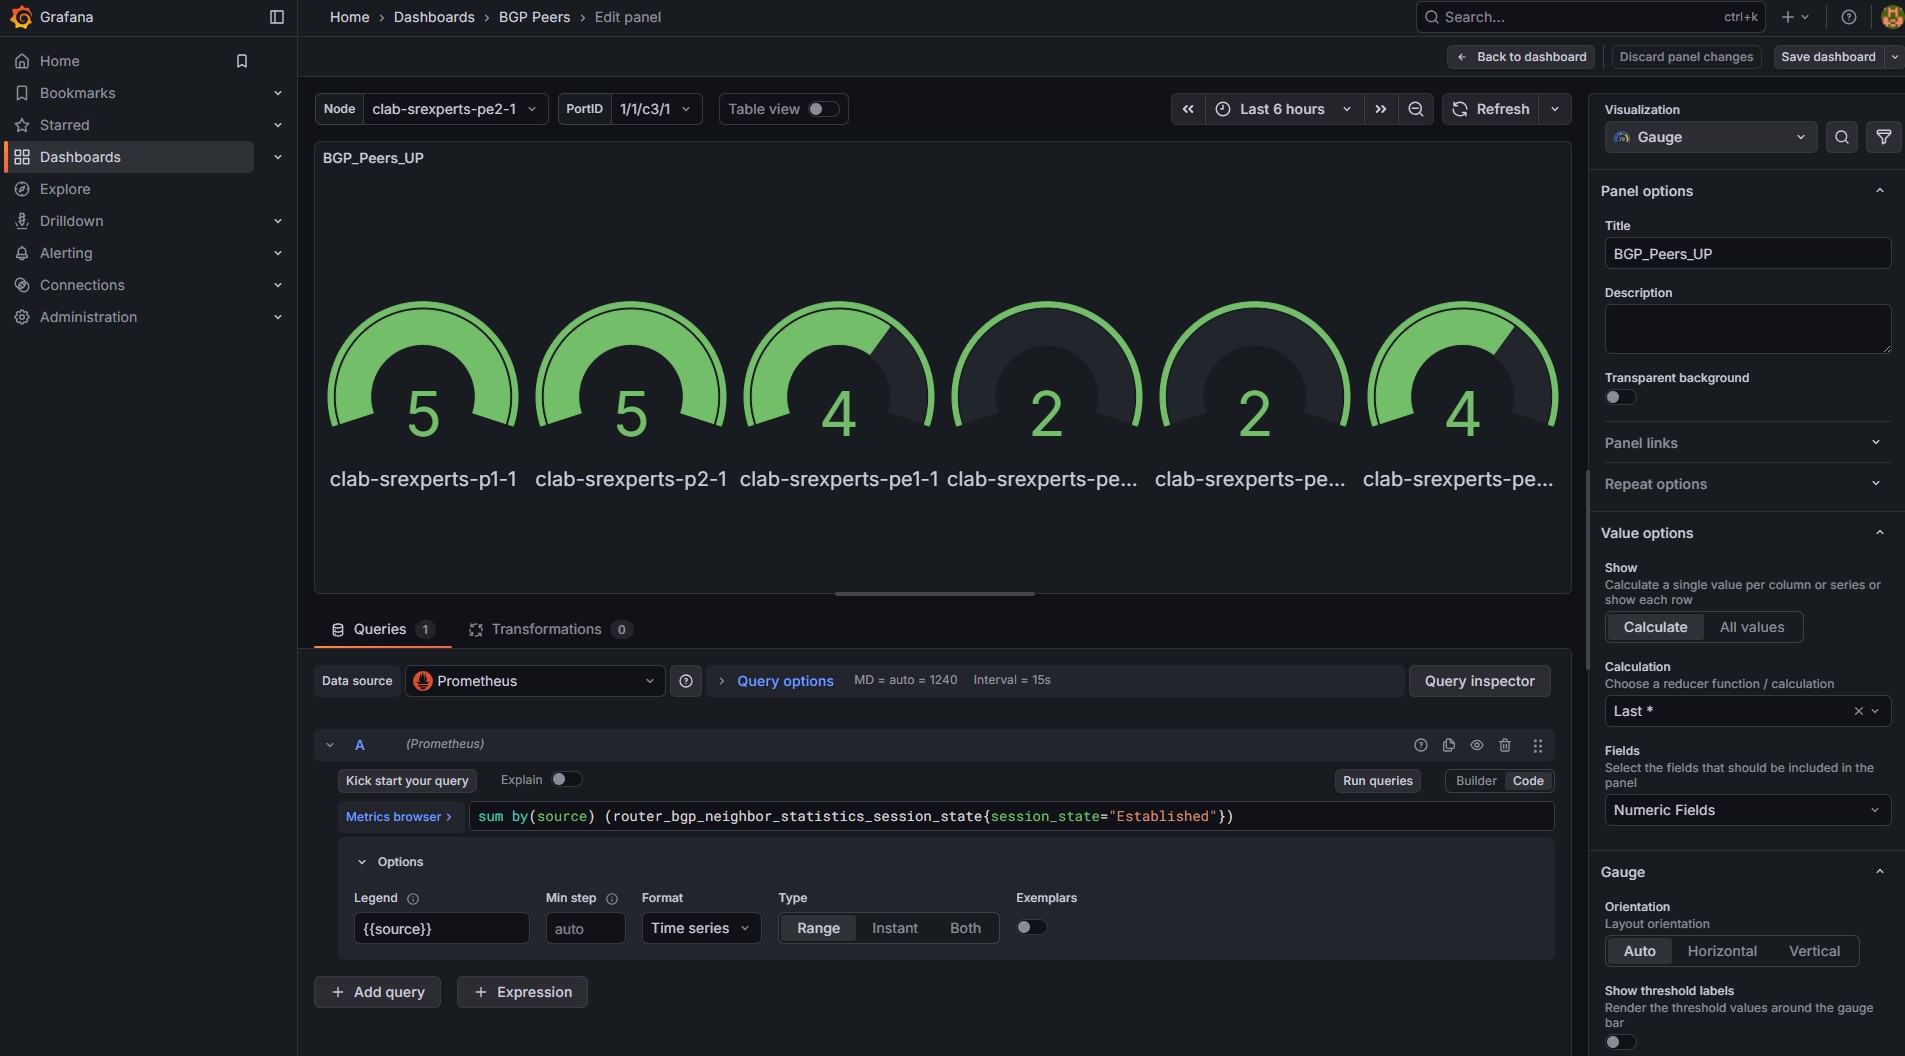
To calculate the "BGP Peers UP" (established sessions) you must sum the metric router_bgp_statistics_peers with "Established" state, per source.
The PromQL query below is enhanced to search only the last entry per node and per neighbor and in case there are no entries for a node (all peers down/bgp shutdown) it will display 0 entries.
- Click
+ Add visualizationand selectPrometheus - At the bottom you should see the query builder menu.
- Change the Metric view from
BuildertoCode(on the right, next toRun queriesbutton) - In the Metric browser enter the following PromQL query:
sum by(source) (last_over_time(router_bgp_neighbor_statistics_session_state{session_state="Established"}[5s])) or (0 * sum by(source) (router_bgp_statistics_peers))
- Click
> Optionsand chooseCustomfrom theLegenddropdown menu - Type
{{source}}in theLegendbox - In the upper right, click
Time seriesto expand the dropdown menu - Choose
Gaugefrom the dropdown - Set the title to
BGP_Peers_UP - Select
Back to dashboard
Your panel should now look like this with gauges showing only BGP peers UP (established sessions) per node.
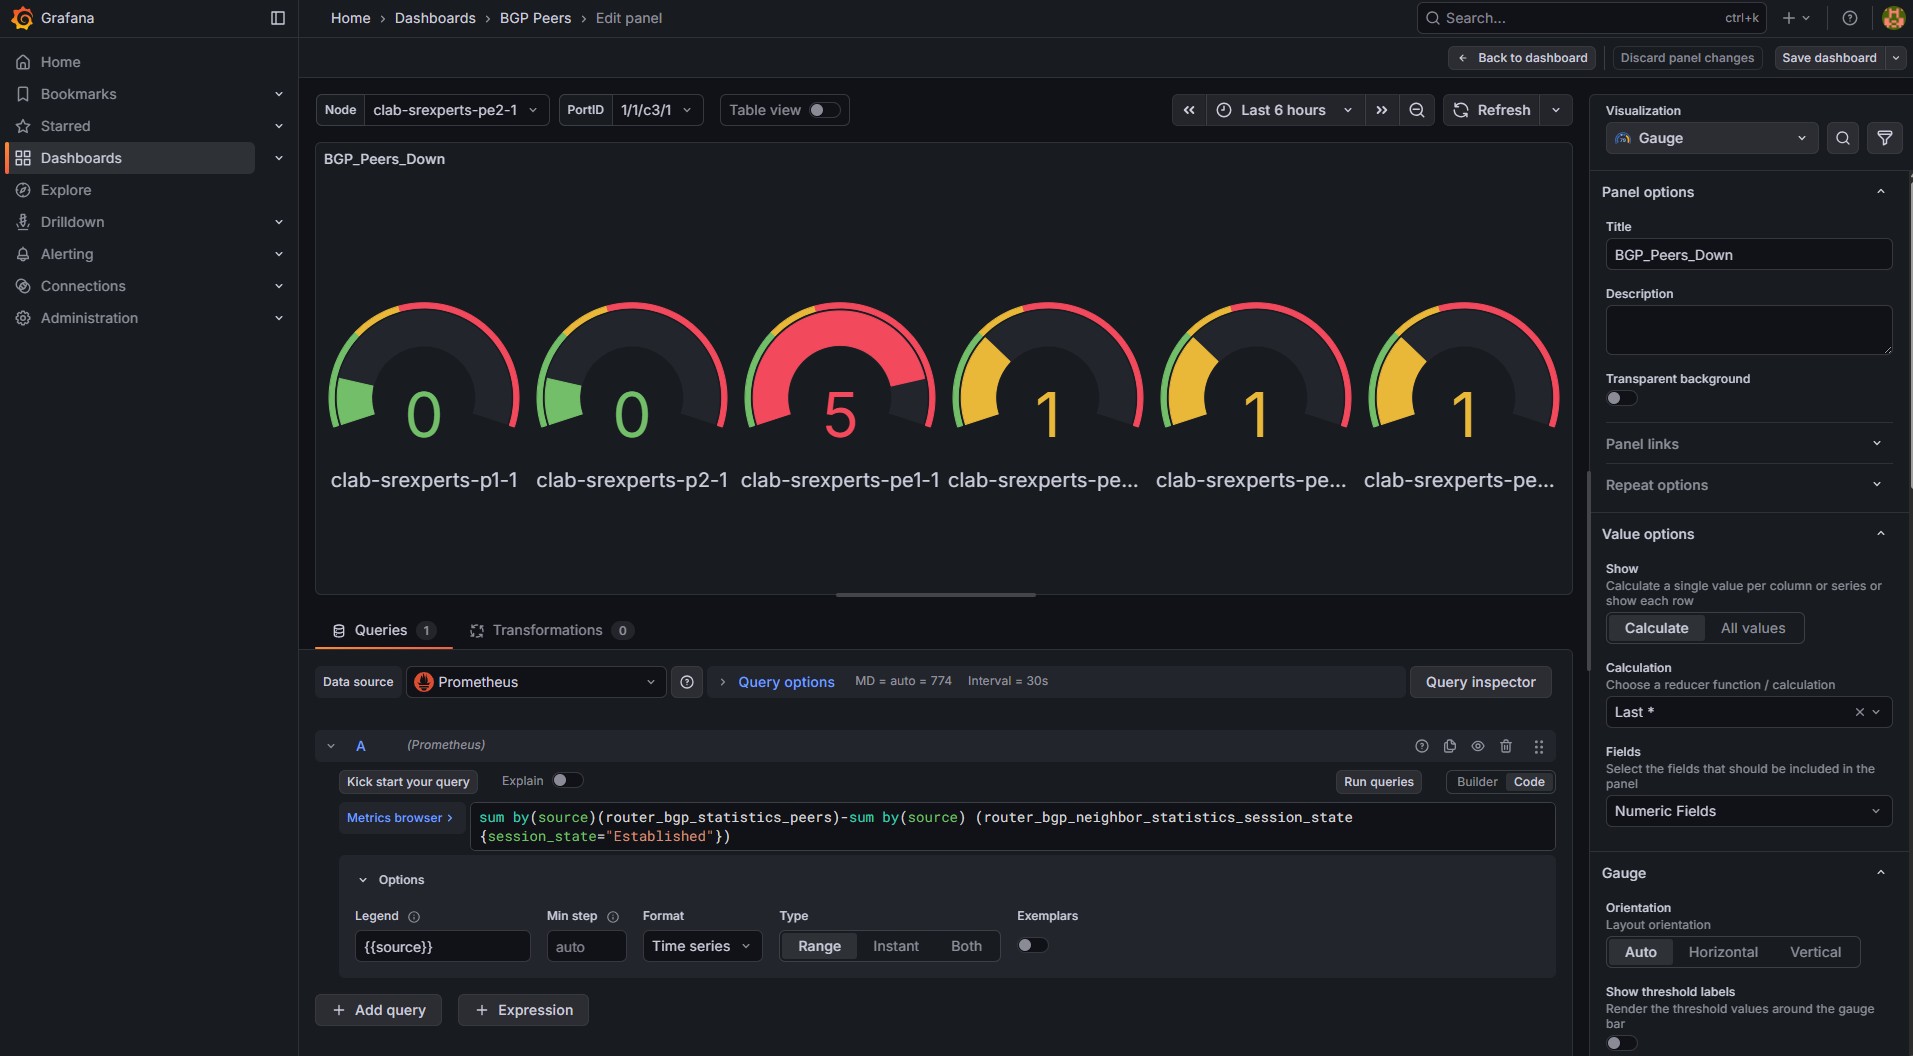
To calculate the "BGP Peers Down" you must subtract the total BGP peers with the BGP peers UP using the formulas from the previous panels.
- Click
+ Add visualizationand selectPrometheus - At the bottom you should see the query builder menu.
- Change the Metric view from
BuildertoCode(on the right, next toRun queriesbutton) - In the Metric browser enter the following PromQL query:
sum by(source)(router_bgp_statistics_peers)-(sum by(source)(last_over_time(router_bgp_neighbor_statistics_session_state{session_state="Established"}[5s]))or(0 * sum by(source)(router_bgp_statistics_peers)))
- Click
> Optionsand chooseCustomfrom theLegenddropdown menu - Type
{{source}}in theLegendbox - In the upper right, click
Time seriesto expand the dropdown menu - Choose
Gaugefrom the dropdown - Set the title to
BGP_Peers_Down - Scroll down and select the color scheme "From Thresholds (by value)"
- In the Thresholds set base color to
green,yellow=1andred=2 - Click
applyin the upper right corner andSave dashboard - Select
Back to dashboard
Your panel should now look like this with gauges showing only BGP peers Down per node.
Your dashboard should look like the one below, showing the three panels with total, up and down BGP peers per node.
4. Summary and Review#
Congratulations! You managed to integrate the nodes into the streaming telemetry stack as requested. A few more dashboards and your network is ready for production!
If you have got this far you have completed this activity and achieved the following:
- Learnt how streaming telemetry is used for network monitoring and the advantages over SNMP
- Understood how to identify and subscribe to streaming telemetry metrics with gNMIc using the subscribe RPC
- Examined how the components of the telemetry monitoring stack work together
- Learnt how to configure and enable streaming telemetry using gNMI over gRPC on SR OS
- Used the Grafana visualization tool to create your own dashboard using the metrics streamed from SR OS
This is a pretty extensive list of achievements! Well done!
If you're hungry for more have a go at another activity! Perhaps try a topic that is new to you?