SR Linux remote logging with Syslog and Loki#
| Activity name | SR Linux remote logging with Syslog and Loki |
| Activity ID | 52 |
| Short Description | In this activity you'll configure logging on the SRLinux nodes and explore the logging stack with Promtail, Loki, and Grafana. |
| Difficulty | Beginner |
| Tools used | SR Linux documentation Grafana Loki Promtail Nokia YANG Browser gNMIc |
| Topology Nodes | Leaf21, Spine21, Grafana, Promtail, Loki |
| References | SR Linux Logging SR Linux Log Events Guide |
In today's rapidly evolving network environments, maintaining robust and efficient operations is more critical than ever. Remote logging plays a pivotal role in achieving this by providing a comprehensive and centralized method for monitoring, analyzing, and troubleshooting network activities across diverse and distributed systems.
In the network field, remote logging using Syslog is a de facto standard way to implement logging. Typically, the network nodes sends syslog messages to a centralized syslog collector, and an operator eyeballs the aggregated logs on the collector.
With the proliferation of distributed computing systems, the logging systems had a solid boost both in terms of log collection techniques, aggregation, querying and visualization. Modern logging stacks and services emerged - Logstash, Loki, Datadog, and dozens of cloud-provided logging solutions.
1. Objective#
You are a Network Engineer working on a project to deploy a new data-center with SR Linux nodes. EDA is planned for the future and will not be used. Your team have already installed, configured, and integrated the IP fabric in the existing network, and the next step before its ready for production is to integrate the nodes in the management systems. Syslog, for remote logging, is now being configured and you have been asked to complete this work.
In this activity you will test and validate logging configurations on the SR Linux nodes and explore a modern logging stack based on Loki, Promtail and Grafana. You will discover how to configure remote logging on SR Linux and apply various filters to granularly select the messages for logging and verify how modern distributed logging improves the operational experience.
2. Technology explanation#
SR Linux logging is implemented via the standard Linux rsyslog package. Configuration consists of three main steps:
- Specifying an input source
- Optionally filtering messages
- Specifying an output destination.
You can use Linux syslog facilities (e.g. local6, local7, etc.) or SR Linux subsystems (e.g. aaa, acl, vxlan, etc.) as log sources. By default, SR Linux subsystem messages are logged to the local6 facility.
You can define a filter based on a syslog tag and apply it to a destination.
SR Linux supports the following logging destinations:
- Log file (default path:
/var/log/srlinux/file) - Memory buffer (stored at
/var/log/srlinux/buffer, non-persistent) - Console (
/dev/console) - Remote server
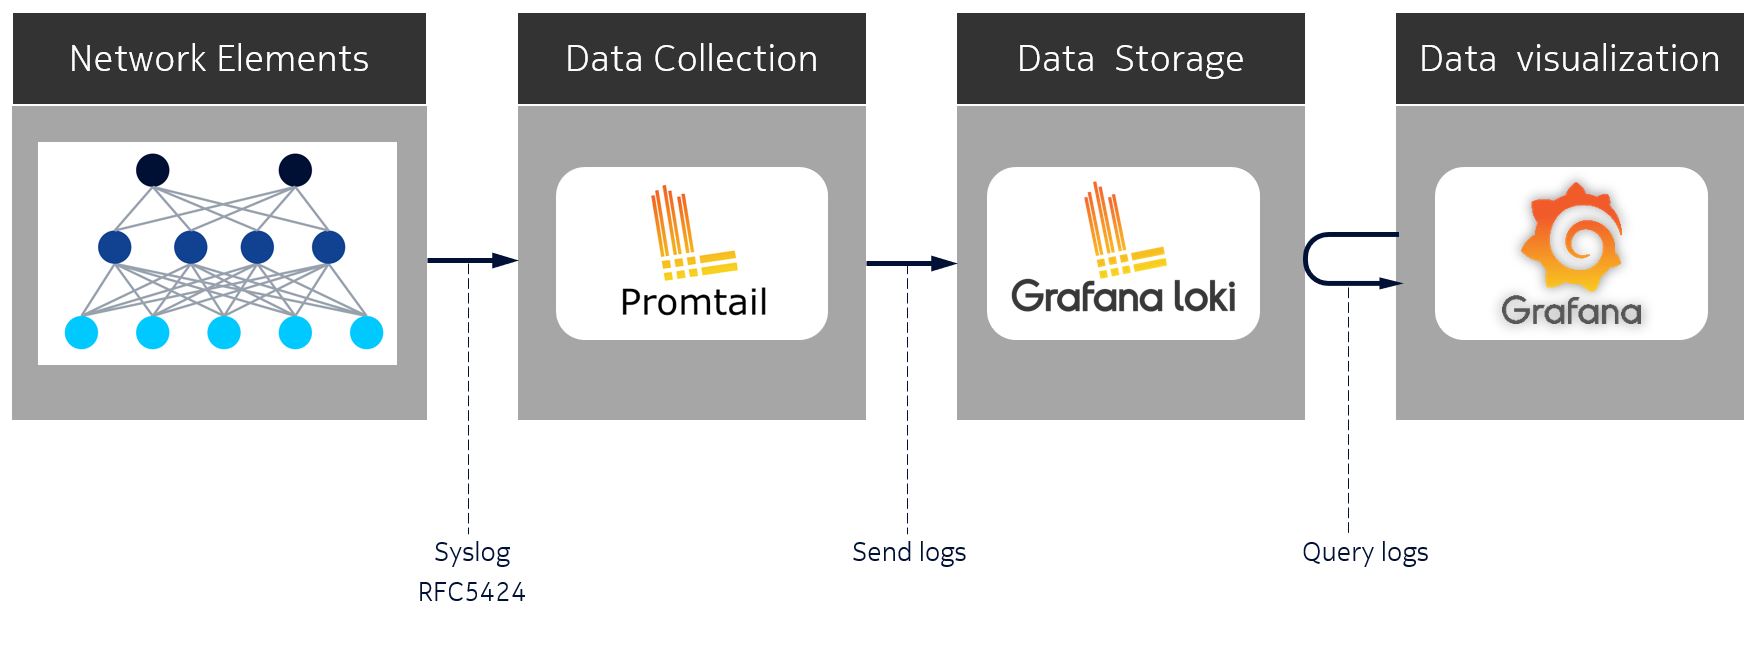
In this activity you'll send logging to a remote destination. The logging stack in the setup is composed of:
- A syslog collector - Promtail
- A database for central log storage - Loki
- A visualization tool - Grafana for querying and analyzing data
At a high level, SR Linux nodes will send syslog messages formatted according to RFC5424 to Promtail, which is responsible for collecting the logs. Promtail will create additional labels assigned to the logs and pass them through to the Loki database. Grafana can then query the logs based on the labels assigned to them.
3. Tasks#
You should read these tasks from top-to-bottom before beginning the activity.
It is tempting to skip ahead but tasks may require you to have completed previous tasks before tackling them.
3.1 SR Linux syslog#
You've been requested to validate the Syslog configuration on the nodes and over the full stack.
Let's start from the beginning of the data pipeline and validate the logging configuration on SR Linux nodes.
Start by logging into Leaf21 and inspecting the existing logging configurations.
Tip
This is Leaf21's logging configuration:
--{ + running }--[ system logging ]--
A:leaf21# info
    network-instance mgmt
    buffer messages {
        rotate 3
        size 10000000
        facility local6 {
            priority {
                match-above informational
            }
        }
    }
    buffer system {
        facility auth {
            priority {
                match-above warning
            }
        }
        # <snippet>
    }
    file messages {
        rotate 3
        size 10000000
        facility local6 {
            priority {
                match-above warning
            }
        }
    }
    remote-server 10.128.1.75 {
        transport udp
        remote-port 1514
        facility local6 {
            priority {
                match-above informational
            }
        }
    }
Can you explain the configuration blocks?
In this activity a remote-destination is used to send the log messages to the Promtail service that acts as a syslog collector and forwarder. Can you identify the configurations to send syslog to Promtail?
Solution
Description of the existing configuration:
- network-instance mgmt - network-instance that the SR Linux uses to contact the remote servers.
- buffer messages / buffer system - Log files maintained in memory, non-persistent across system reboots
- file messages - Log files maintained on disk, persistent across system reboots
- remote-server 10.128.
.75 - remote destination to Promtail
The system logging remote-server 10.128.<group-id>.75 context has the required configurations to send logs to Promtail. The network-instance mgmt can be defined at loggingor remote-server levels.
In this example we run as a Group ID: 1 user, so the IP address of the syslog collector is 10.128.1.75. You should see your group ID.
--{ + running }--[  ]--
A:leaf21# system logging remote-server 10.128.1.75

--{ + running }--[ system logging remote-server 10.128.1.75 ]--
A:leaf21# info detail
    transport udp
    remote-port 1514
    facility local6 {
        priority {
            match-above informational
        }
    }
You should notice that the config snippet doesn't show individual subsystems configured, but only has a local6 facility configured with a rule matching informational level priority and above. By default, SR Linux subsystem messages are logged to Linux syslog facility local6, which gives us a configuration efficiency if we want to capture all messages.
3.1.1 Log message format#
Consider the following example of syslog-formatted messages for the chassis subsystem that can be seen on SR Linux:
Syslog-formatted messages
2024-05-17T20:27:21.252868+00:00 leaf21 local6|NOTI sr_chassis_mgr: chassis|1476|1476|00122|N: The subinterface ethernet-1/50.0 is now up
2024-05-17T20:27:23.630370+00:00 leaf21 local6|NOTI sr_chassis_mgr: chassis|1476|1476|00123|N: Interface lag1 is now up
2024-05-17T20:27:23.630388+00:00 leaf21 local6|NOTI sr_chassis_mgr: chassis|1476|1476|00124|N: The subinterface lag1.1 is now up
2024-05-17T20:27:23.630494+00:00 leaf21 local6|NOTI sr_chassis_mgr: chassis|1476|1476|00125|N: The subinterface lag1.101 is now up
The log message format that is used by rsyslog when sending to remote destination has the following signature:
Log message format
<TIMESTAMP> <HOSTNAME> <FACILITY>|<SEVERITY> <APPLICATION>: <SUBSYSTEM>|<PID>|THREAD_ID|SEQUENCE|<SEVERITY>: <MESSAGE>
where
<TIMESTAMP>   - Time in format - MMM DD HH:MM:SS.
<HOSTNAME>    - SR Linux hostname.
<APPLICATION> - SR Linux application name, in the context of Syslog this is the Message ID.
<SUBSYSTEM>   - SR Linux subsystem name, which is configured under /system/logging/remote-server
<PID>         - Process ID.
<THREAD_ID>   - Thread ID.
<SEQUENCE>    - Sequence number, which allows to reproduce order of the messages sent by SR Linux.
<SEVERITY>    - A singe char indicating criticality of the message (I - informational, W - warning, etc.)
<MESSAGE>     - Application free-form message that provides information about the event, that could contain network-instance name, like "Network-instance default".
3.1.2 Log message capture#
The format that rsyslog uses to send log messages to the remote destination differs from the default format used for buffer and file destination.
To see the messages on the wire as they are being sent towards a remote syslog collector users can leverage tcpdump tool available on SR Linux.
Open a new session to Leaf21 and start a packet capture at Leaf21 and trigger event logs in the node.
You'll see logs similar to the ones shown below:
admin@g51-leaf21:~$ bash network-instance mgmt tcpdump -vAnni mgmt0.0 port 1514
tcpdump: listening on mgmt0.0, link-type EN10MB (Ethernet), snapshot length 262144 bytes

07:50:36.937551 mgmt0.0 Out IP (tos 0x0, ttl 64, id 10656, offset 0, flags [DF], proto UDP (17), length 182)
    10.128.1.33.48501 > 10.128.1.75.1514: UDP, length 154
E...).@.@..+..!..K.u....zj<182>1 2024-05-21T07:50:36.937263+00:00 leaf21 sr_cli - - -  debug|896501|896501|00003|I: common    |admin|45|srl running / | info interface ethernet-1/1
You may trigger event logs by login, execute a commit or perform other actions. You may execute the following gNMIc commands from your hackathon instance that will disable and re-enable a port to trigger event logs.
You should see these logs in the packet capture.
Disable and re-enable a port to trigger logs
Run these gNMIc commands from your hackathon instance to disable and re-enable a port to trigger logs.
Note: A get RPC is also included to display the status before and after the set.
### get status
gnmic -a clab-srexperts-leaf21:57401 -u admin -p $EVENT_PASSWORD --skip-verify -e json_ietf get \
    --path '/interface[name=ethernet-1/31]/admin-state' | grep -e enable -e disable
### set status disable
gnmic -a clab-srexperts-leaf21:57401 -u admin -p $EVENT_PASSWORD --skip-verify -e json_ietf set \
--update-path '/interface[name=ethernet-1/31]/admin-state' --update-value disable
### get status
gnmic -a clab-srexperts-leaf21:57401 -u admin -p $EVENT_PASSWORD --skip-verify -e json_ietf get \
    --path '/interface[name=ethernet-1/31]/admin-state' | grep -e enable -e disable
### get status
gnmic -a clab-srexperts-leaf21:57401 -u admin -p $EVENT_PASSWORD --skip-verify -e json_ietf get \
    --path '/interface[name=ethernet-1/31]/admin-state' | grep -e enable -e disable
### set status enable
gnmic -a clab-srexperts-leaf21:57401 -u admin -p $EVENT_PASSWORD --skip-verify -e json_ietf set \
--update-path '/interface[name=ethernet-1/31]/admin-state' --update-value enable
### get status
gnmic -a clab-srexperts-leaf21:57401 -u admin -p $EVENT_PASSWORD --skip-verify -e json_ietf get \
    --path '/interface[name=ethernet-1/31]/admin-state' | grep -e enable -e disable
3.2 Promtail#
Now you are at a point when a raw syslog message has been generated by SR Linux and sent towards its first stop - Promtail.
Promtail and Loki instances are already deployed as part of the lab running on your cloud instance.
Promtail will take the raw syslog and generate additional labels associated with the log entry. The log processing/transformation is a very important process, it allows you to enrich, parse and tune the log messages before they are sent to the log collector.
Inspect the Promtail configuration file and try to interpret each section.
You can find the Promtail configuration file on your hackathon instance in ~/SReXperts/clab/configs/promtail/promtail-config.yml
Output: Promtail configuration file
You can view the Promtail configuration file with the command below:
# Copyright 2023 Nokia
# Licensed under the BSD 3-Clause License.
# SPDX-License-Identifier: BSD-3-Clause

clients:
  - url: http://loki:3100/loki/api/v1/push

scrape_configs:
  - job_name: syslog
    syslog:
      listen_address: 0.0.0.0:1514
      listen_protocol: udp
      idle_timeout: 300s
      label_structured_data: yes
      labels:
        job: "syslog"
    relabel_configs:
      - source_labels: ["__syslog_message_hostname"]
        replacement: clab-srexperts-$1
        target_label: "source"
        regex: (?:g\d+)-([a-z]+\d+|vRR)
      - source_labels: ["__syslog_message_severity"]
        target_label: "level"
      - source_labels: ["__syslog_message_app_name"]
        target_label: "application"
      - source_labels: ["__syslog_message_facility"]
        target_label: "facility"
      - source_labels: ["__syslog_message_proc_id"]
        target_label: "procid"
Can you describe what each section is doing?
Solution: Promtail configuration break down.
Have a closer look at each section.
This section specifies where Promtail should send the logs to. In this case, it's sending logs to a Loki instance, by referring to its DNS name. The loki name is resolved by docker to the associated IP address of the Loki container.
Next we define Promtail to be used as a syslog collector. It listens on all IP addresses (including 10.128.${INSTANCE_ID}.75) on UDP port 1514 and generates a static label job: syslog which will be applied to all log entries.
Relabel configs is used to manipulate or add labels to the log entries. These labels can be very useful when querying them from the Loki database. In the example below we manipulate only one label - the source label.
source_labels extracts a value from the specified field in the syslog message, in this case the hostname, and replaces it with clab-srexperts-$1 and applies it to the target_label source.
Besides altering the value of the source label, we also use the values from the syslog internal values (e.g. __syslog_message_severity) and apply the value to a label with a more human-friendly name level.
scrape_configs:
    #<snippet>
    relabel_configs:
      - source_labels: ["__syslog_message_hostname"]
        replacement: clab-srexperts-$1
        target_label: "source"
      - source_labels: ["__syslog_message_severity"]
        target_label: "level"
      - source_labels: ["__syslog_message_app_name"]
        target_label: "application"
      - source_labels: ["__syslog_message_facility"]
        target_label: "facility"
      - source_labels: ["__syslog_message_proc_id"]
        target_label: "procid"

3.3 Loki#
Time to open up Loki and query some logs based on the label created by Promtail.
Open the Grafana UI on your laptop use the following address: http://<group-id>.srexperts.net:3000
Log into the Grafana dashboard with admin/${EVENT_PASSWORD} credentials.
With Grafana UI loaded:
- Use the menu in the top left corner
- Click on Explore
- Select Loki as data source in the top left corner (by default Prometheus is selected)
- Note: In query builder, on the right you'll see the
Builder/Codeswitch button. Ensure you switch toBuilder.
- Note: In query builder, on the right you'll see the
- In
Label filterselect labelsourcewith valueclab-srexperts-leaf21 - Click blue button titled
Run queryin the right corner - You should now see all the logs related to
clab-srexperts-leaf21 - Add a extra search label by clicking on
+next to your existing label filter - In
Label filterselect labelapplicationwith valuesr_cli - Click
Run queryagain - You should now see all CLI log messages sourced from
clab-srexperts-leaf21
You may explore other options such as filtering with expressions present in the log message.
3.4 Grafana#
You can now create Grafana dashboards to provide custom visualizations, using your Loki logs. Have a look at the existing Syslog or SR Linux Telemetry dashboards.
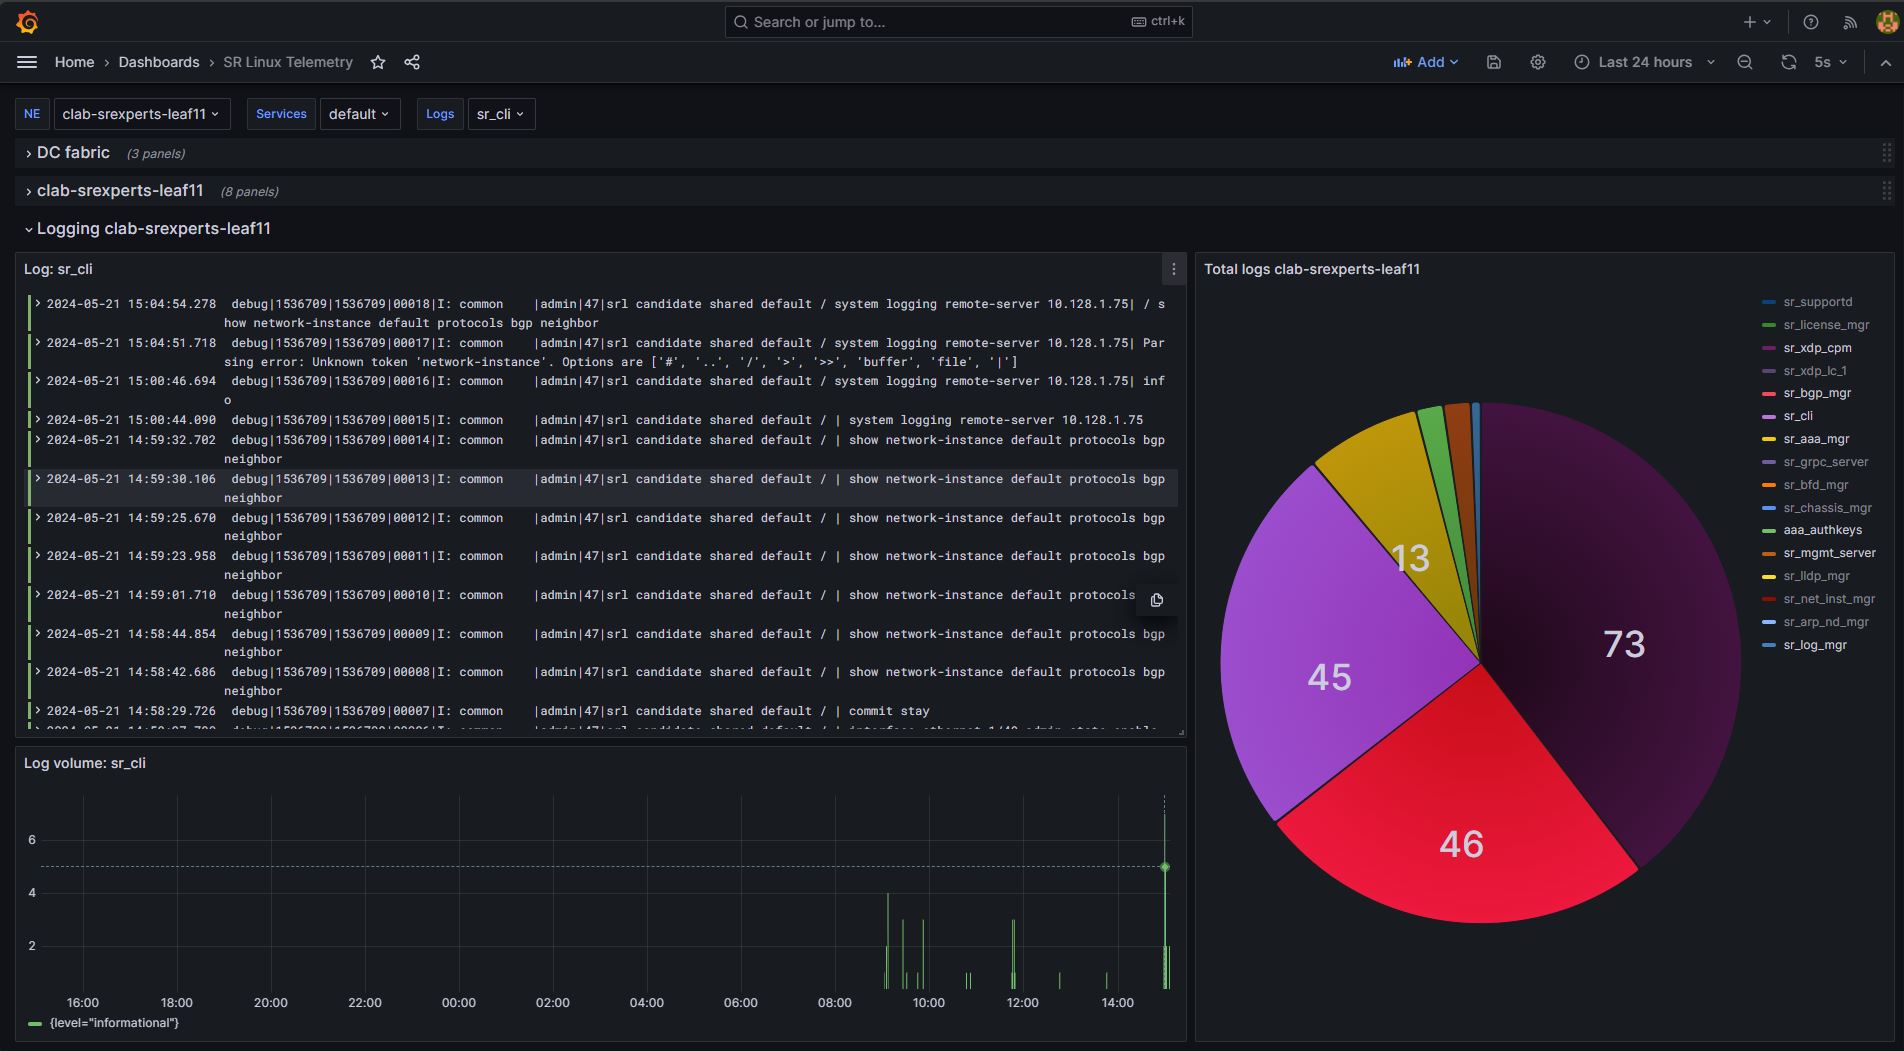
Add a new dashboard to Grafana displaying log messages including the following panels:
- A nodal Pie chart to display the total number of logs per node and per application
- A nodal time series to display the number of logs per node and per application over time
- A syslog list per node and per application
Tip: Add Grafana dashboard
There's already a Syslog dashboard with several display panels that you may use as reference. You may view their settings and replicate. To view the settings, you need to select edit in the top right corner, and then Settings.
From the Settings menu, have a look at the existing variables, you'll need to create these variables in your dashboard.
Solution: Add Grafana dashboard
There are several options to create your dashboards, you may duplicate/clone existing dashboards, or you may use existing json code and then modify.
In here we'll provide the instructions to do it manually from scratch but feel free to follow other approach.
Start by creating a new dashboard named srx_SRL_Syslog and select Loki as data source. Then add the variables and the visualization panels following the instructions below.
You need to create variables that you will use later to filter the logs.
- In your dashboard click
Editin the top right corner - Click
Settingsand selectVariables - Click
Add variableand create a variable with the following parameters- Name: NE
- Data source: Loki
- Query type: Label values
- Label: source
- Scroll down and click
Run queryto confirm it returns the nodes - Click
Back to list - Click
New variableand create a variable with the following parameters- Name: Logs
- Data source: Loki
- Query type: Label values
- Label: application
- Scroll down and click
Run queryto confirm it returns the applications - Click
Back to listand thenBack to dashboard
Create the visualization panels with the settings listed below. To create the panels you need to click Edit in the top right corner and then Add -> Visualization.
Note: To make it easier, change the query builder from builder to code and use the expressions provided. Ensure you select Loki as data source.
-
Create a panel named "Node - Pie Chart", define the type
What does it do? It counts log lines over the last 30 seconds and groups the result by the application label.Pie Chartand add the following code:
-
Create a panel named "Node - count per app", define the type
What does it do? Shows how many log lines per second each application is generating over the last 30 seconds.Time Seriesand add the following code:
-
Create a panel named "Syslog - per node", define the type
What does it do? Select all logs from the selected network element where the application label exists and is not empty.Logsand add the following code:
3.5 Optional task: Automate with gNMIc#
EDA is planned for the future, so for now you have to rely on other tools for automation.
You received the feedback that there are too many logs from the fabric nodes being received at the central system during some operations and during maintenance windows. There's a request to implement a tool with automation that is capable of changing the syslog priority level that is matched on-demand to:
- For the operations team:
noticeand above - Within maintenance windows:
criticaland above
Use gNMIc to change the logging configuration on Leaf21 so that only messages that match syslog priority level critical and above are forwarded to the remote-server.
Hint: How to retrieve the gNMI path
You may use the YANG browser to retrieve the gNMI path. Search by "facility priority match-above" and it will return the following:
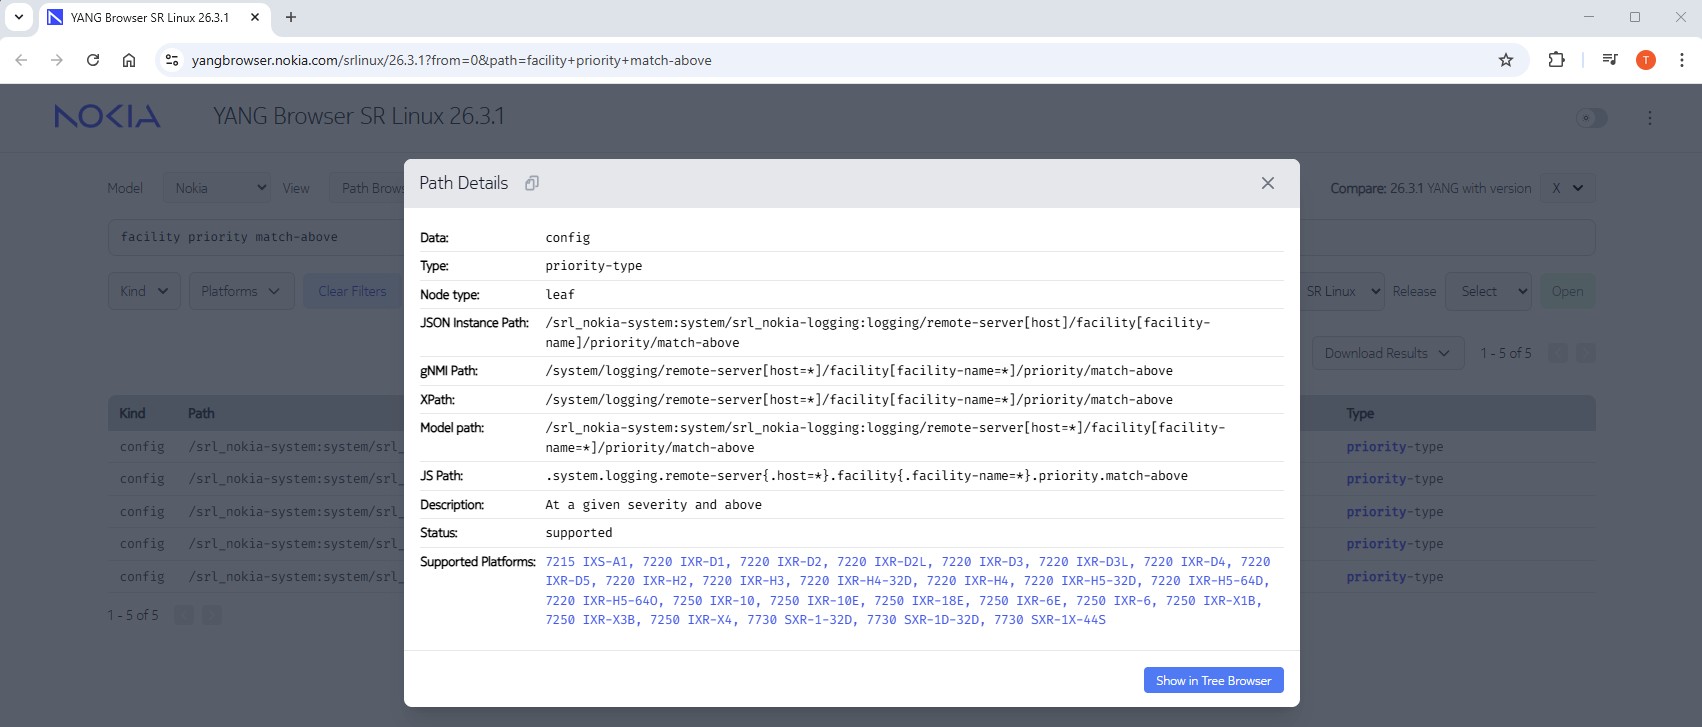
From the CLI you may also retrieve the XPath. Note that the output below was taken from Group-ID 51, you output will display your Group-ID.
--{ +* candidate shared default }--[ system logging remote-server 10.128.51.75 facility local6 priority ]--
A:admin@g51-spine21# pwc xpath
/system/logging/remote-server[host=10.128.51.75]/facility[facility-name=local6]/priority


--{ +* candidate shared default }--[ system logging remote-server 10.128.51.75 facility local6 priority ]--
A:admin@g51-spine21# info
    match-above informational
Solution
This is the get to retrieve the configured value.
gnmic -a clab-srexperts-leaf21:57401 -u admin -p $EVENT_PASSWORD --skip-verify -e json_ietf get \
    --path '/system/logging/remote-server[host=*]/facility[facility-name=local6]/priority/match-above'
Output:
$ gnmic -a clab-srexperts-leaf21:57401 -u admin -p $EVENT_PASSWORD --skip-verify -e json_ietf get \
    --path '/system/logging/remote-server[host=*]/facility[facility-name=local6]/priority/match-above'
[
  {
    "source": "clab-srexperts-leaf21:57401",
    "timestamp": 1778689125100629157,
    "time": "2026-05-13T16:18:45.100629157Z",
    "updates": [
      {
        "Path": "srl_nokia-system:system/srl_nokia-logging:logging",
        "values": {
          "srl_nokia-system:system/srl_nokia-logging:logging": {
            "remote-server": [
              {
                "facility": [
                  {
                    "facility-name": "local6",
                    "priority": {
                      "match-above": "informational"
                    }
                  }
                ],
                "host": "10.128.4.75"
              }
            ]
          }
        }
      }
    ]
  }
]
This is the set to configured the new value to critical:
## set to critical
gnmic -a clab-srexperts-leaf21:57401 -u admin -p $EVENT_PASSWORD --skip-verify -e json_ietf set \
--update-path '/system/logging/remote-server[host=*]/facility[facility-name=local6]/priority/match-above' \
--update-value critical
This is the set to configured the value back to informational:
This is the output you see when you set the logging priority to critical.
$ ## set to critical
gnmic -a clab-srexperts-leaf21:57401 -u admin -p $EVENT_PASSWORD --skip-verify -e json_ietf set \
--update-path '/system/logging/remote-server[host=*]/facility[facility-name=local6]/priority/match-above' \
--update-value critical
{
  "source": "clab-srexperts-leaf21:57401",
  "timestamp": 1778689160324784727,
  "time": "2026-05-13T16:19:20.324784727Z",
  "results": [
    {
      "operation": "UPDATE",
      "path": "system/logging/remote-server[host=*]/facility[facility-name=local6]/priority/match-above"
    }
  ]
}
$ gnmic -a clab-srexperts-leaf21:57401 -u admin -p $EVENT_PASSWORD --skip-verify -e json_ietf get \
    --path '/system/logging/remote-server[host=*]/facility[facility-name=local6]/priority/match-above'
[
  {
    "source": "clab-srexperts-leaf21:57401",
    "timestamp": 1778689166040818549,
    "time": "2026-05-13T16:19:26.040818549Z",
    "updates": [
      {
        "Path": "srl_nokia-system:system/srl_nokia-logging:logging",
        "values": {
          "srl_nokia-system:system/srl_nokia-logging:logging": {
            "remote-server": [
              {
                "facility": [
                  {
                    "facility-name": "local6",
                    "priority": {
                      "match-above": "critical"
                    }
                  }
                ],
                "host": "10.128.4.75"
              }
            ]
          }
        }
      }
    ]
  }
]
Start a packet capture at Leaf21 bash and use gnmic again to disable and re-enable the port and observe the logs.
Question: Do you see any logs in the capture?
You should see only critical and above. The port down alarms are severity warning and are not displayed.
Interface down logs:
23:52:13.477844 IP (tos 0x0, ttl 64, id 60312, offset 0, flags [DF], proto UDP (17), length 196)
    10.128.4.43.59275 > 10.128.4.75.1514: UDP, length 168
E.....@.@...
.3+
.3K........<180>1 2026-04-10T23:52:13.477689+00:00 g51-leaf21 sr_chassis_mgr - - -  chassis|3279|3279|00168|W: Interface ethernet-1/31 is now down for reason: port-admin-disabled

23:52:13.477917 IP (tos 0x0, ttl 64, id 60313, offset 0, flags [DF], proto UDP (17), length 195)
    10.128.4.43.59275 > 10.128.4.75.1514: UDP, length 167
E.....@.@...
.3+
.3K......-&<180>1 2026-04-10T23:52:13.477709+00:00 g51-leaf21 sr_chassis_mgr - - -  chassis|3279|3279|00169|W: The subinterface ethernet-1/31.0 is now down for reason: port-down

23:52:13.478404 IP (tos 0x0, ttl 64, id 60314, offset 0, flags [DF], proto UDP (17), length 274)
    10.128.4.43.59275 > 10.128.4.75.1514: UDP, length 246
E.....@.@...
.3+
Go back to your Grafana Dashboards and visualize the logs you have generated and confirm that you are indeed only receiving critical (and above) logs.
Set syslog back to informational
Before you move to another activity, restore the logging configuration back to informational with the gnmic call below.
gnmic -a clab-srexperts-leaf21:57401 -u admin -p $EVENT_PASSWORD --skip-verify -e json_ietf set \
    --update-path '/system/logging/remote-server[host=*]/facility[facility-name=local6]/priority/match-above' \
    --update-value informational
Finally, confirm with your Grafana dashboards that you are now receiving logs with severity informational and above.
4. Summary and Review#
Congratulations! If you have got this far you have completed this activity and achieved the following:
- You have configured SR Linux to send syslog messages to a remote server
- You have learnt the role of Promtail and explored it's configuration
- You have used Loki to query logs
- You have created Grafana dashboards consuming logs from Loki
- You have automated syslog configuration using
gnmic
This is a pretty extensive list of achievements! Well done!
If you're hungry for more have a go at another activity! Perhaps try a topic that is new to you?