Ask EDA: AI-Assisted Network Operations#
| Short Description | Use Ask EDA, the AI assistant built into EDA, to query, visualize, troubleshoot, and operate your data center fabric using natural language. |
| Difficulty | Beginner |
| Topology Nodes | leaf11, leaf12, leaf13, spine11, spine12 |
| References | EDA Documentation, Ask EDA Documentation, EQL Query Language |
Ask EDA is the conversational (chat) interface built into the Nokia Event-Driven Automation (EDA) platform. It allows you to interact with Nokia EDA using natural-language chat, enabling root cause analysis, network-wide queries, AIOps assistance, dashboard creation, and context-specific help.
1. Objective#
The goal of this activity is to get hands-on experience with Ask EDA and discover how an AI assistant can accelerate day-to-day network operations. By the end, you should be able to:
- Query live network state across the entire fabric using natural language
- Create real-time visualizations (pie charts, counters, line charts) from network data
- Leverage Ask EDA's context awareness to get relevant answers without specifying every detail
- Execute network operations (repeated ping checks) and operational actions without SSH
- Triage alarms and understand the difference between alarms and deviations
- Investigate past network events using temporal queries
2. Technology Explanation#
2.1 What is Ask EDA?#
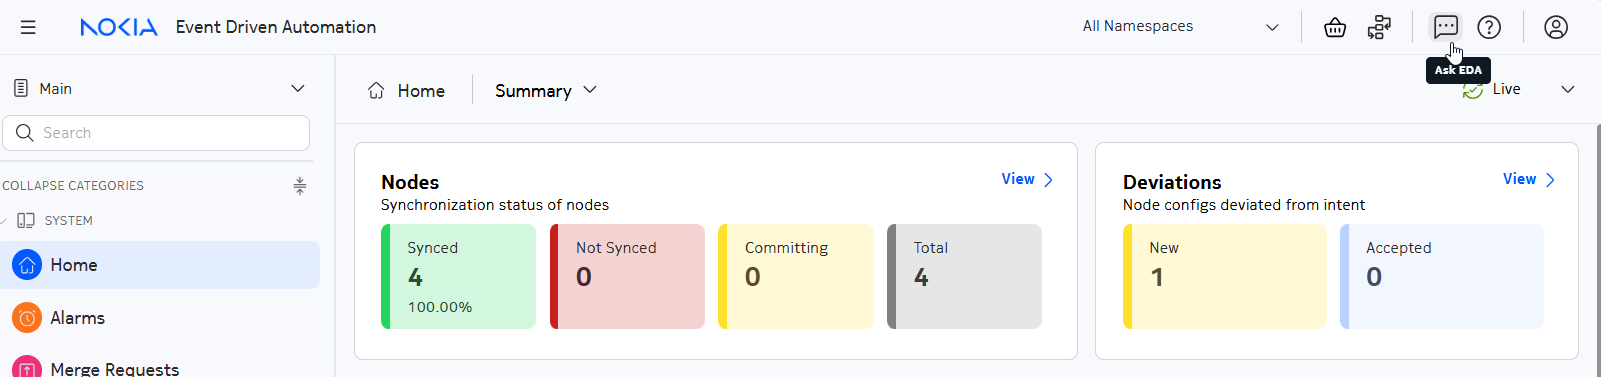
Ask EDA is the AI-powered assistant accessible from within the EDA UI. It sits in the top-right corner of the screen and acts as a conversational interface to the entire EDA platform.
Key properties:
- Context-aware: Ask EDA knows which screen you are viewing in the UI. Navigate to a node, an alarm, or a service, and Ask EDA automatically scopes its answers to what you're looking at.
- EQL-fluent: when you ask a question about network state, Ask EDA translates your natural language into EDA Query Language (EQL) queries internally. You get live-streaming results without ever writing a query yourself.
- Action-capable: Ask EDA doesn't just answer questions. It has access to tools that let it execute operations on the network: ping, techsupport collection, path discovery, and more. You tell it what you want, and it figures out how.
- Multi-LLM: Ask EDA routes queries to specialized models (e.g., reasoning models for alarm diagnosis, charting models for visualizations). The active model can be changed mid-session. The enabled LLMs are managed through LLM Providers.
- Multi-language: Ask EDA understands queries in multiple languages.
2.2 Using Ask EDA#
To access Ask EDA, click on the Ask EDA icon (a chat-bubble) in the top-right corner of any EDA UI screen.
When you click the Ask EDA icon, a chat panel opens, docked to the right of the screen.
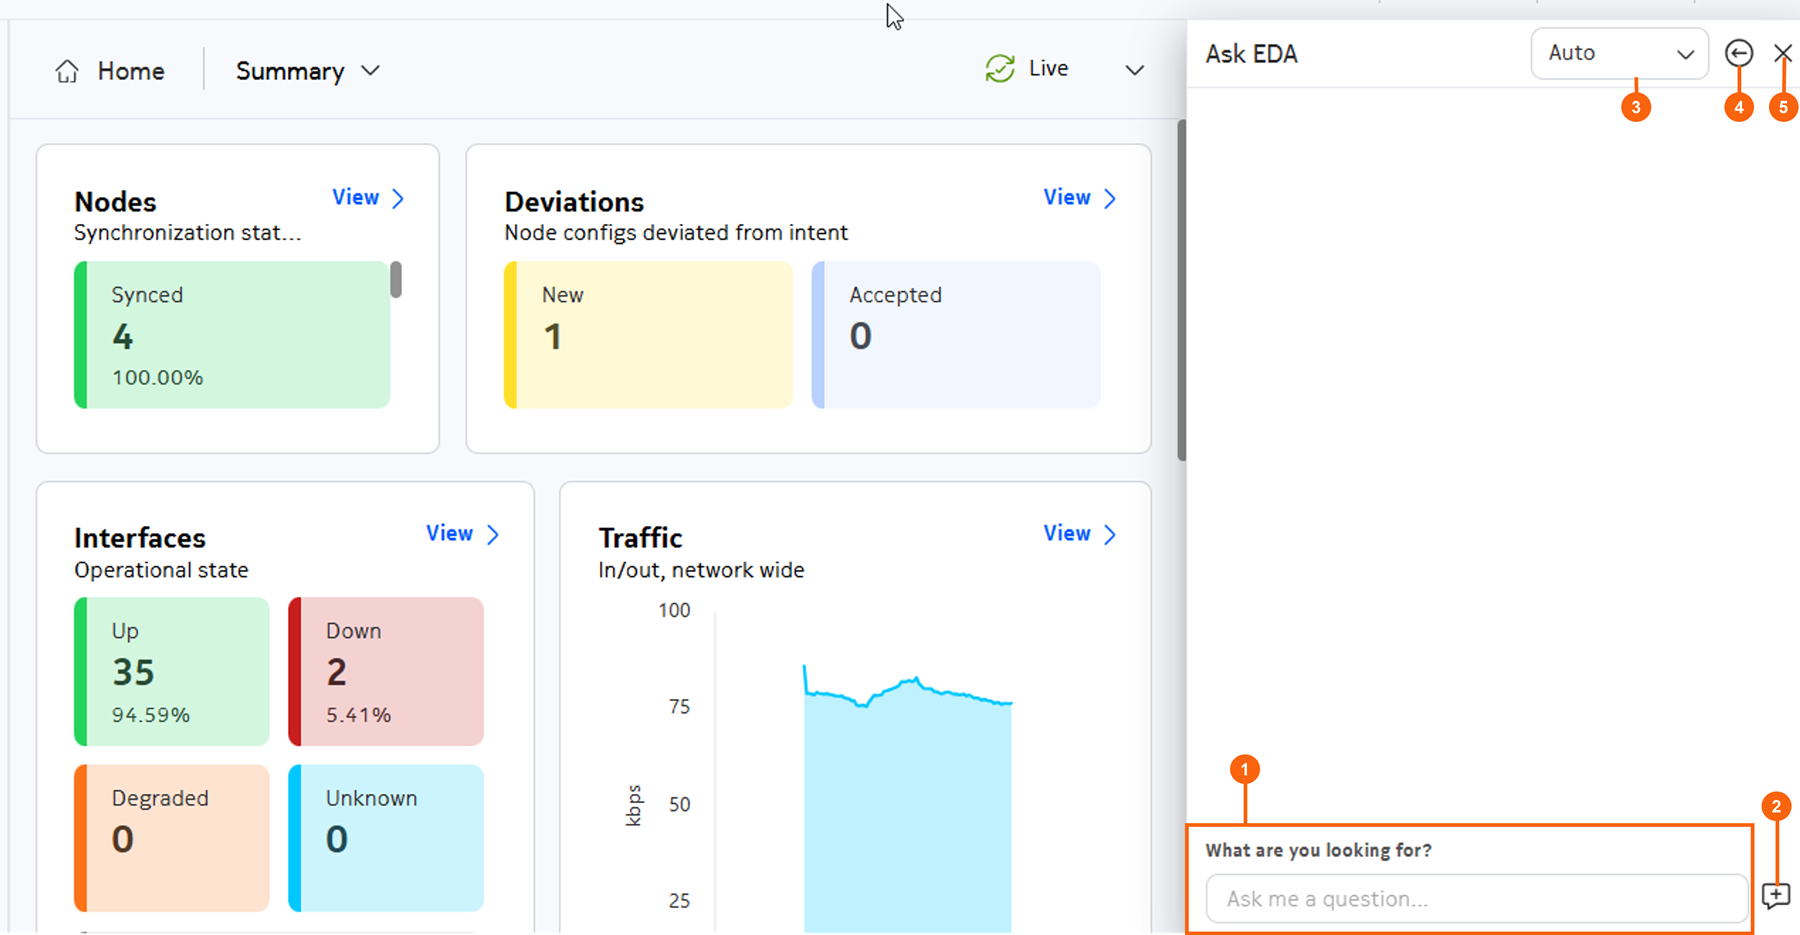
Table: Elements of the Ask EDA window
| # | Element |
|---|---|
| 1 | Input bar |
| 2 | Start new conversation icon |
| 3 | Model type drop-down list (Auto, Reasoning, or Standard) |
| 4 | Full screen toggle (full screen / docked) |
| 5 | X (close) |
When you send a query, you can choose how the agent selects the underlying model:
- Auto: the tool or prompt selects whether to use a reasoning model or not.
- Standard: the called tool or prompt uses a non-reasoning model, if available. This model is for data retrieval or command execution.
- Reasoning: the called tool or prompt uses a reasoning model, if available. The reasoning model is typically used for analysis, synthesis, or explanation.
2.3 Key EDA Concepts#
A few EDA concepts are helpful to know before starting:
- Namespaces: EDA organizes resources in namespaces. The default namespace is
eda. - EQL (EDA Query Language): a structured query language for streaming state data from nodes. Ask EDA generates EQL for you behind the scenes. If you want to learn EQL directly, see the EDA Query Language exercise.
- Alarms: EDA surfaces network events (e.g., BGP peer down) as alarms in the UI. Alarms are symptoms of issues in your network or platform.
- Deviations: EDA acts as the single source of truth for the configuration of that node and continuously monitors its state. Any out-of-band changes will be classified as deviations.
- Transactions: all configuration changes in EDA are grouped into transactions with dry-run and rollback support. If something looks unexpected, checking the transaction history is a good first step.
3. Tasks#
See Access Details if you need a reminder on how to access the EDA UI and lab nodes.
3.1 Meet Ask EDA#
Before diving into network tasks, familiarize yourself with the EDA UI and open the Ask EDA chat panel.
Log in to the EDA UI and locate the Ask EDA chat icon in the top-right corner of the screen. Open it and introduce yourself. Ask EDA will tell you what it can help with.
Once the chat is open, try to figure out if Ask EDA is aware of what you are currently viewing in the UI. Navigate to a couple of different pages (e.g., the main dashboard, then Topology → Nodes) and simply ask:
Ask EDA is context-aware, so it adapts its answers based on which page you are currently viewing. Navigating to a different page and asking the same question produces a different response. This context awareness is a key feature you will use throughout this activity.
3.2 Query Live Network State#
As a network operator, one of the most common tasks is checking the state of interfaces across the fabric. Traditionally this means SSH-ing into each switch and running show commands. Ask EDA can query the entire fabric at once from a single natural language prompt.
Your task is to get Ask EDA to show you a table of all SR Linux interfaces in the eda namespace, then iteratively refine the results:
- Get a table of all interfaces across the managed nodes.
- Narrow the results to show only interfaces that are administratively enabled.
- Reduce the visible columns to just the oper-state, oper-down-reason and MTU.
Pay attention to the table Ask EDA returns. It streams updates in real time, so if an interface state changes on the network while you're looking at the table, the data refreshes automatically.
Hint
You don't need to write a single query that does everything at once. Ask EDA supports conversational refinement. Ask for the full list first, then ask follow-up questions to filter and trim columns. Each follow-up builds on the previous result.
Add the namespace name to the query to help Ask EDA narrow down the results to the correct namespace.
Solution
A possible prompt sequence:
Then refine:
And trim columns:
Ask EDA translates each prompt into an EQL query behind the scenes. For example, the final state might correspond to something like:
.namespace.node.srl.interface fields [oper-state, oper-down-reason, mtu] where (.namespace.name = "eda" and admin-state = "enable")
This is a great way to learn the EDA Query Language (EQL)!
3.3 Visualize Fabric State#
Numbers and tables are useful, but sometimes a visual overview is more effective, whether for a status meeting, a quick health check, or simply to create a dashlet for a dashboard you're working on. Ask EDA can generate dashboard elements (dashlets) from live network data if you ask it to.
Your task is to create four different types of visualizations:
- A pie chart showing the distribution of BGP neighbor session states (established, idle, active, etc.) across the fabric.
- A counter chart of interfaces grouped by operational state (up/down). Try to customize the colors so that "up" is green and "down" is red.
- A line chart of interface traffic rates in bps across all nodes.
- A bar chart of any other statistic you are interested in, make it your own.
All charts stream live data: watch them update as the fabric state changes.
Hint
Ask EDA understands chart type keywords like "pie chart", "counter chart", and "line chart". You can also modify existing charts with follow-up prompts, for example by changing colors or making the chart thicker.
Solution
A possible prompt sequence:
If the chart looks too thin:
For the counter chart:
Then customize colors:
For the line chart:
Example solution for the bar chart: A chart indicating the total number
Create a bar chart showing the total amount of SR Linux interfaces where admin-state is "enable", grouped per node
To flip the orientation of the bar chart:
Note
You can drag and drop these charts straight into the dashboard creator to build your own custom dashboards. More information on this can be found in the Dashboards Activity
3.4 Context-Aware Reachability Checks#
Verifying reachability across a fabric typically involves SSH-ing into nodes and running ping or traceroute. EDA can execute these operations directly from the UI using Workflow resources. Ask EDA can trigger workflows and use the topology object you are viewing as the source.
Your task:
- Navigate to System -> Topologies and open the physical topology layout.
- Select one of the leaf switches. Ask EDA what node you are looking at to confirm the context.
- Ask EDA to check reachability from the selected node to several other nodes or endpoint system addresses.
- Ask it to run a larger ping count for any destination you want to validate more carefully.
- Ask it to list the available paths between two nodes.
Hint
Ask EDA can run the ping workflow multiple times from a single natural language request. You can ask for a group of destinations rather than issuing one ping command at a time.
Solution
From the topology layout, after selecting or opening leaf11:
Then ask for several reachability checks:
Increase the sample size for one destination:
3.5 Context-Aware Alarm Root Cause Analysis#
One of Ask EDA's most powerful features is its awareness of the context the user is in. In this task you will use that context awareness during a real alarm triage workflow.
An instructor-provided script will introduce a network fault. It is your job to figure out what went wrong, find the root cause, and resolve the issue at hand.
Run the fault injection script from the lab server:
Your task is to investigate the unhealthy fabric and bring it back to 100% health. Start from the Fabrics -> Fabric page and double click on the fabric resource to open the resource view.
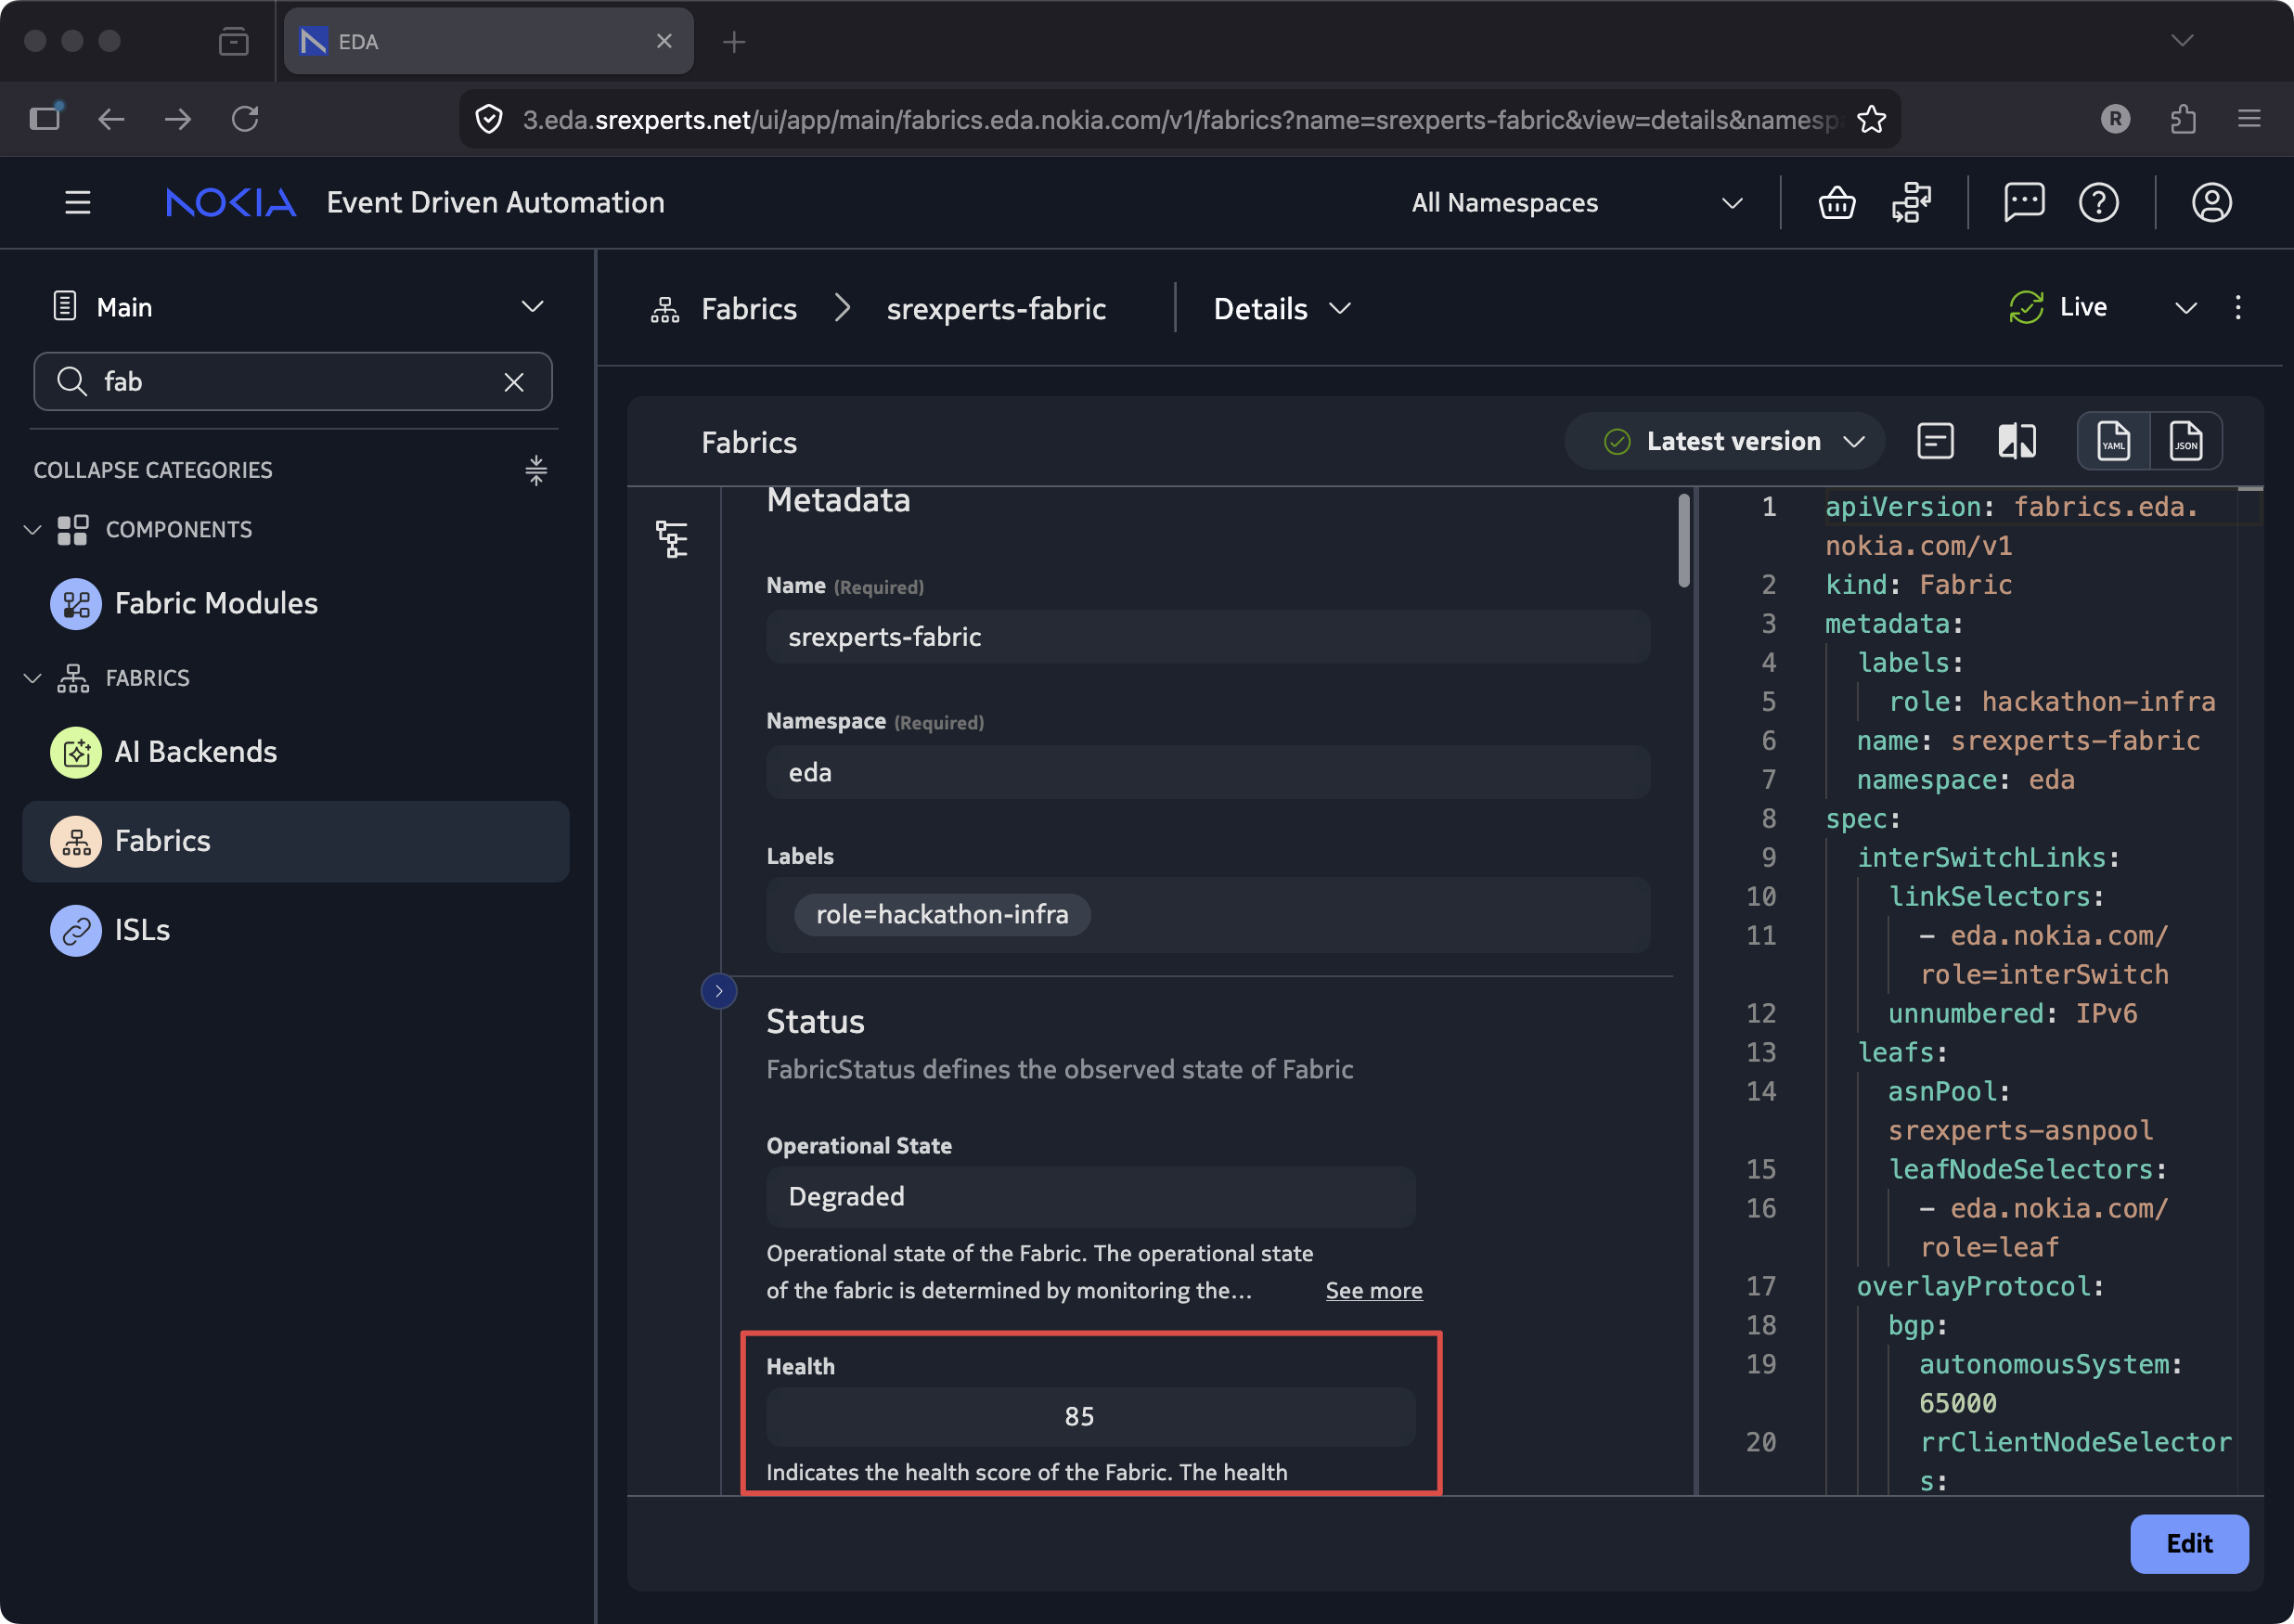
You should see that the fabric resource no longer reports 100% health after the script introduced a fault. Use Ask EDA from that context to decide where to look next, what symptom matters most, and what needs to be fixed.
Let the degraded Fabric resource, alarms, and Ask EDA's context-aware answers guide the investigation.
Hint 1: Start from the degraded fabric
Open the Fabric resource that is not at 100% health and Ask EDA what you are looking at:
Then ask it to explain why the fabric is unhealthy:
Hint 2: Follow the alarms and/or deviations
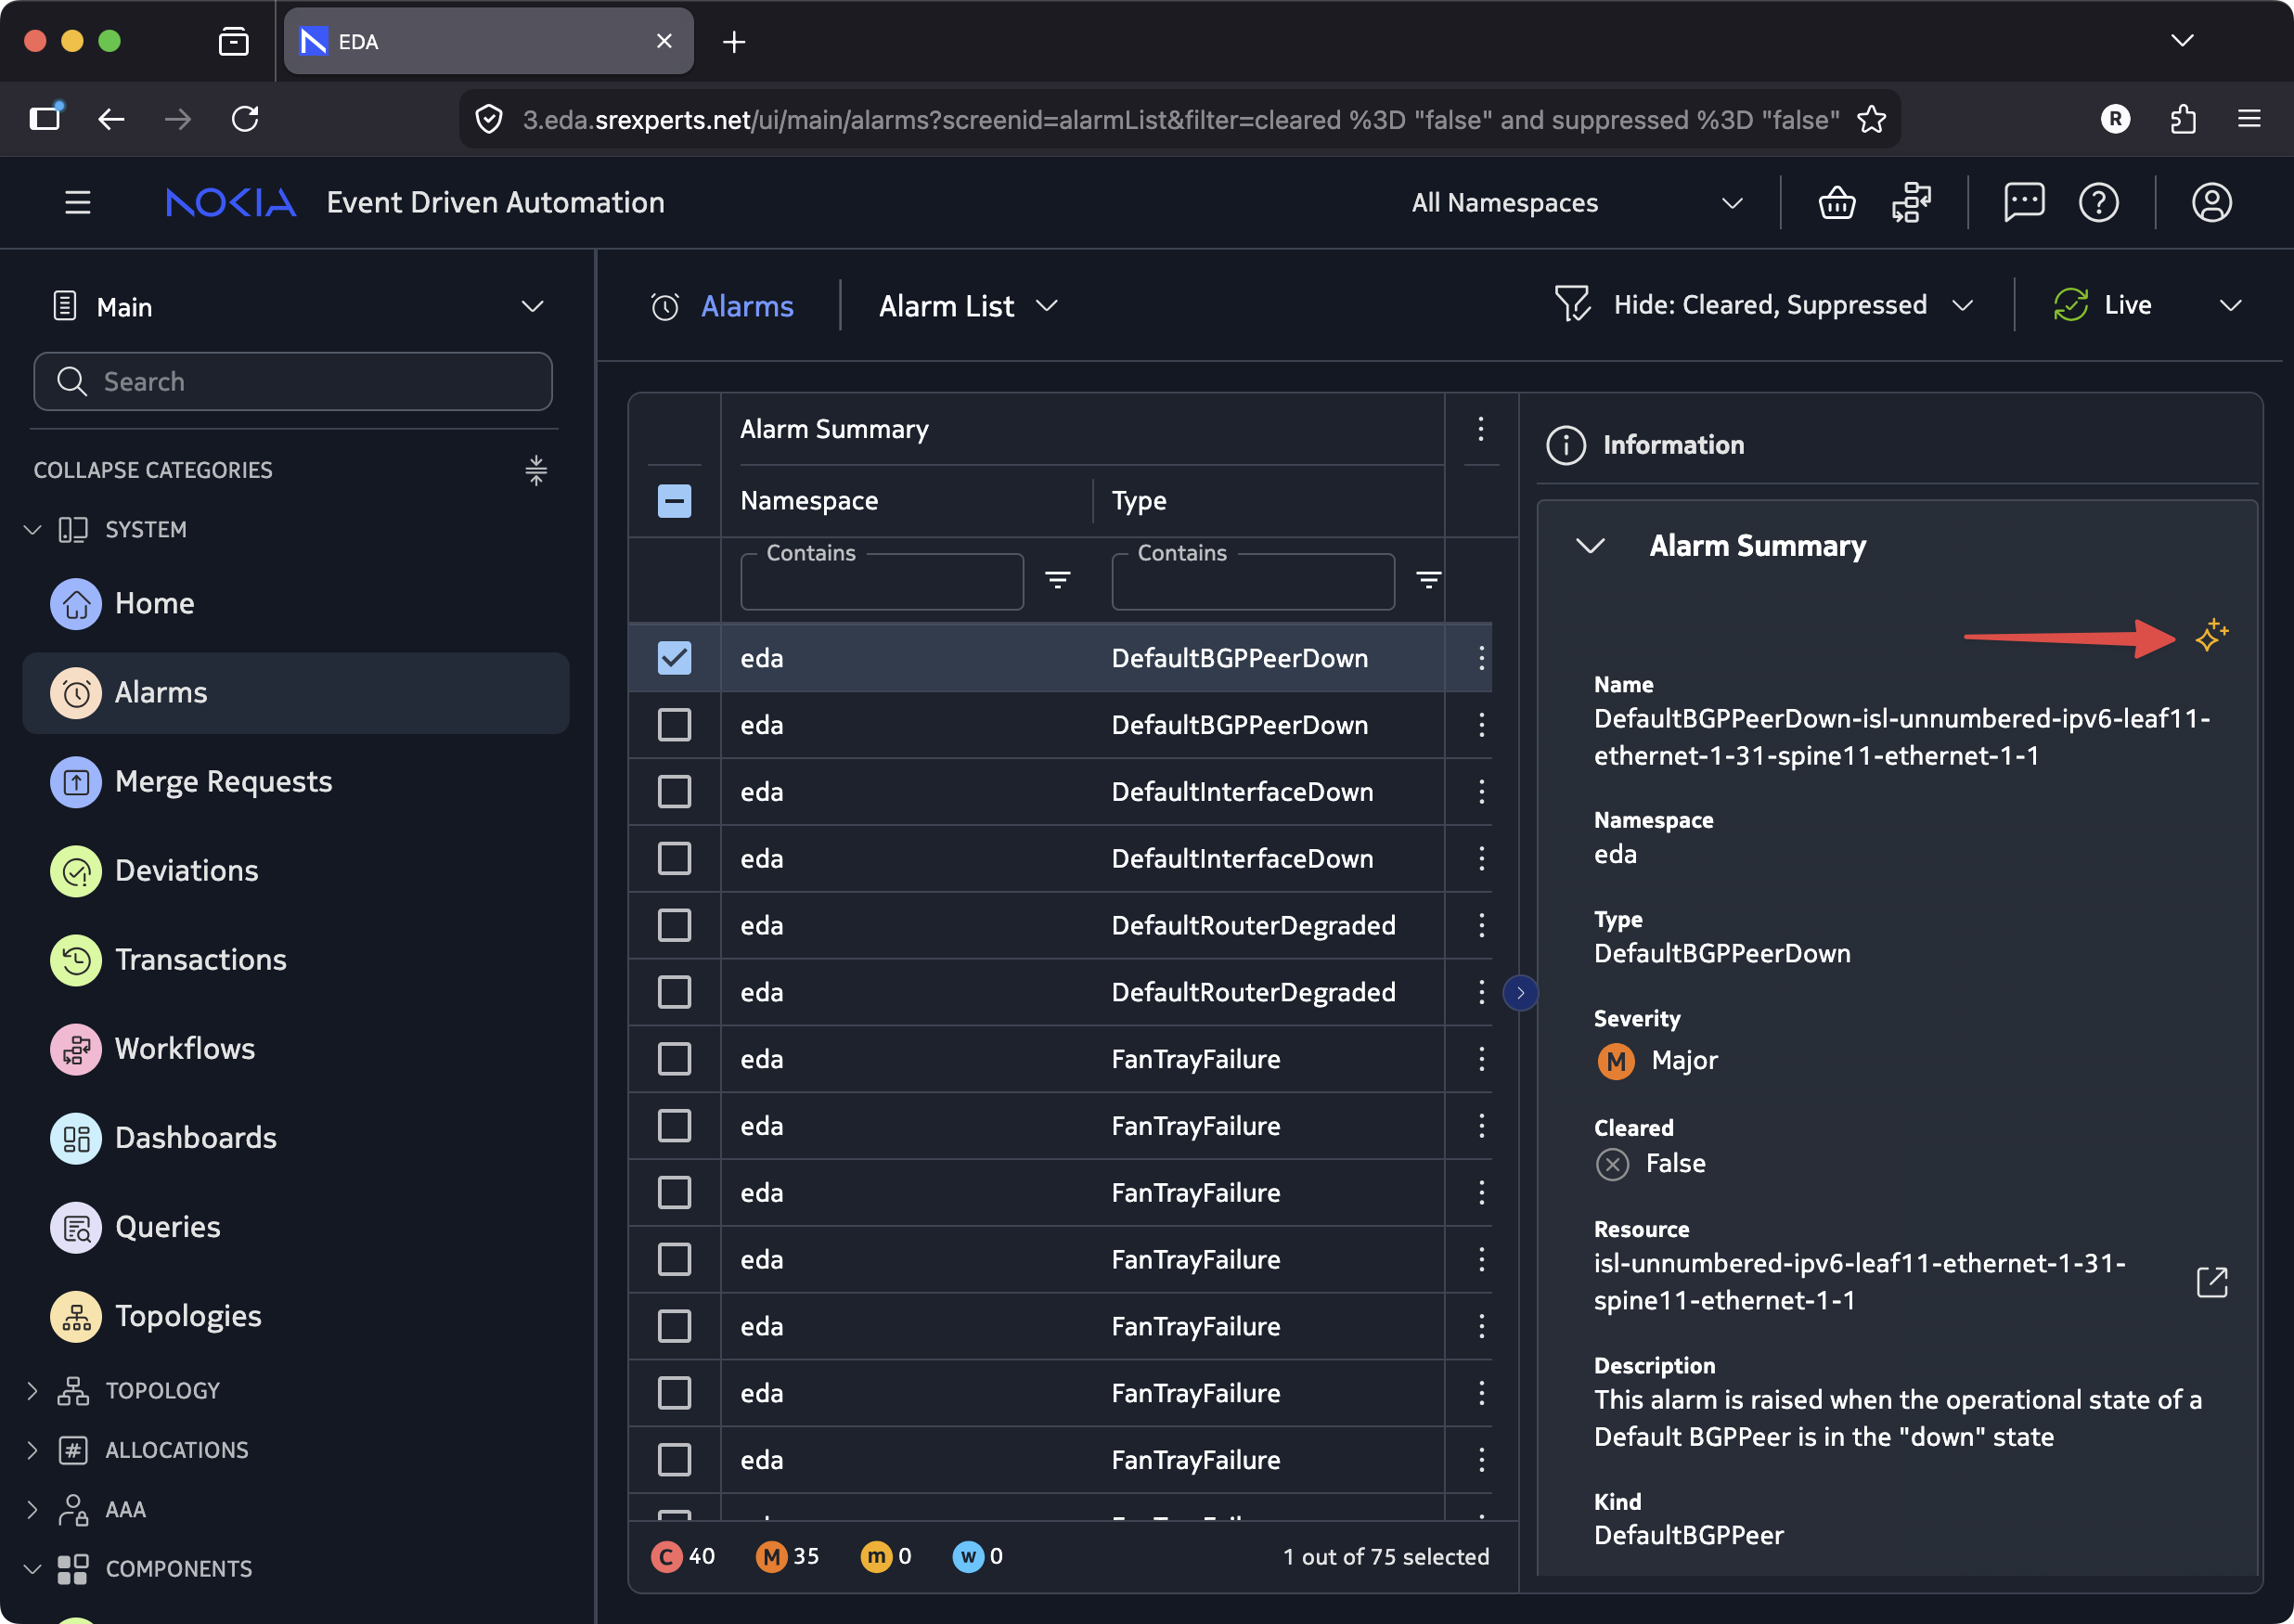
One of the most effective ways to troubleshoot an issue is to let EDA correlate the alarms. Open the Alarm list and select one of the alarms related to the unhealthy fabric and invoke the magic dust:
Sometimes the LLM gods will ask you to check for deviations. The deviations also have the magic dust button, so you use it to ask EDA to investigate the deviation.
Solution
Ask EDA should have led you to the Deviations or Alarms page. It seems the script admin-state disabled one of the interfaces, causing the BGP peering to go down. Hence, the deployed Fabric was no longer healthy. To fix this issue, simply reject the deviation, and verify the fabric's health score to return to 100%. On top of this any related Alarms will disappear.
To verify, you can check the UI, or you can Ask EDA:
3.6 Troubleshoot an Unknown Fault#
In the previous alarm task, the root cause was a deviation: the network's configuration drifted away from the desired configuration. This time the problem is different. A script will cause an issue in your network that is outside of EDA's scope, causing state to go down and alarms to fire, but there is no configuration deviation pointing directly at the answer.
SSH into the lab server and run the fault injection script:
Now switch to the EDA UI and use Ask EDA to figure out what went wrong in your network.
Hint
Open up the Alarms app to make sure Ask EDA is aware of the alarm context. Ask it what happened recently and narrow it down to pinpoint the root cause. Consider switching to the Reasoning model to make sure your LLM agent investigates deeply.
Solution
Start with:
Ask EDA should report recently triggered alarms. Open a specific alarm and ask it to investigate further.
or
or
Ask EDA should point at the member interfaces of lag1 to be down, even though no configuration deviation is seen. It points towards a potential issue on the remote peer connected to the lag1 interface. Which is indeed the case, the script disabled the bond0 interface and its members on client12.
After restoring the network (bash ~/SReXperts/activities/eda/ask-eda/ask-eda-restore.sh), verify:
Restore the network
Make sure you restore the network to its original state using the script ~/SReXperts/activities/eda/ask-eda/ask-eda-restore.sh.
4. Summary#
In this activity you explored Ask EDA's core capabilities across a range of operator workflows:
- Live queries: queried and iteratively refined interface state across the entire fabric in natural language, without writing EQL.
- Visualizations: built pie, counter, line, and bar charts from live streaming data, customizable via follow-up prompts and drag-and-drop ready for dashboards.
- Context awareness: Ask EDA scopes its answers to whatever you're viewing in the UI, letting short questions produce targeted, relevant responses.
- Reachability checks: ran multi-destination ping tests and path discovery from a topology-selected node, no SSH required.
- Alarm triage: traced a fabric health degradation to an out-of-band interface change, identified the deviation, and resolved it without touching the CLI.
- Blind fault investigation: diagnosed a fault with no deviation trail by correlating alarms, protocol state, and recent events to identify a remote peer issue.
The common thread: Ask EDA lets you express your intent in natural language and handles the implementation details, whether that's generating EQL, invoking an operational tool, or investigating an issue in your network.